Lumbee vs Immigrants from Croatia Family Households
COMPARE
Lumbee
Immigrants from Croatia
Family Households
Family Households Comparison
Lumbee
Immigrants from Croatia
63.1%
FAMILY HOUSEHOLDS
0.3/ 100
METRIC RATING
274th/ 347
METRIC RANK
63.1%
FAMILY HOUSEHOLDS
0.3/ 100
METRIC RATING
271st/ 347
METRIC RANK
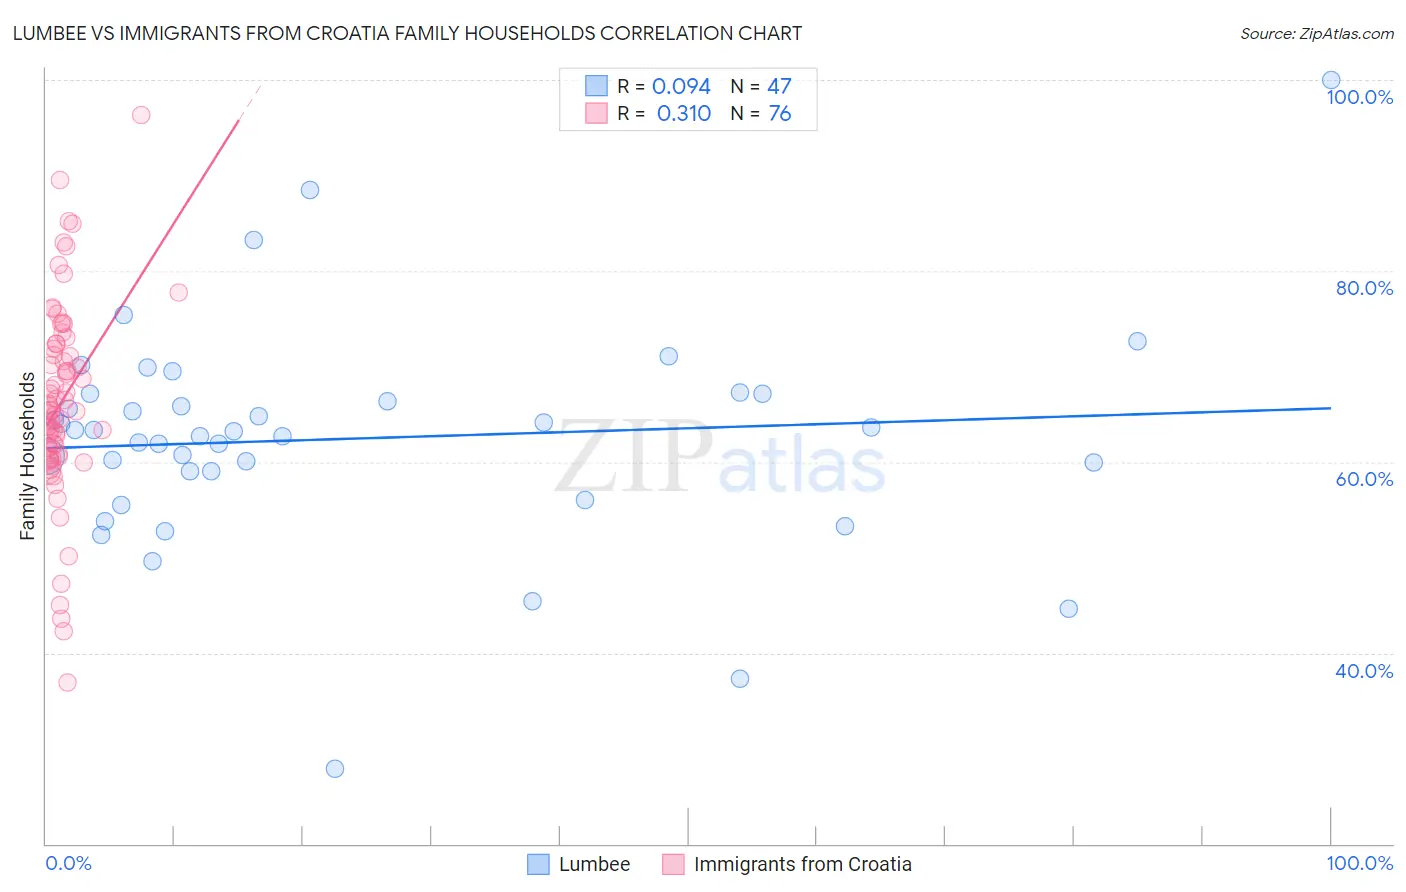
Lumbee vs Immigrants from Croatia Family Households Correlation Chart
The statistical analysis conducted on geographies consisting of 92,265,071 people shows a slight positive correlation between the proportion of Lumbee and percentage of family households in the United States with a correlation coefficient (R) of 0.094 and weighted average of 63.1%. Similarly, the statistical analysis conducted on geographies consisting of 132,568,699 people shows a mild positive correlation between the proportion of Immigrants from Croatia and percentage of family households in the United States with a correlation coefficient (R) of 0.310 and weighted average of 63.1%, a difference of 0.020%.
Family Households Correlation Summary
| Measurement | Lumbee | Immigrants from Croatia |
| Minimum | 27.9% | 36.9% |
| Maximum | 100.0% | 96.4% |
| Range | 72.1% | 59.4% |
| Mean | 62.4% | 66.3% |
| Median | 63.1% | 65.4% |
| Interquartile 25% (IQ1) | 59.0% | 60.7% |
| Interquartile 75% (IQ3) | 67.2% | 72.1% |
| Interquartile Range (IQR) | 8.2% | 11.4% |
| Standard Deviation (Sample) | 11.7% | 10.3% |
| Standard Deviation (Population) | 11.5% | 10.3% |
Demographics Similar to Lumbee and Immigrants from Croatia by Family Households
In terms of family households, the demographic groups most similar to Lumbee are West Indian (63.1%, a difference of 0.0%), Immigrants from Kazakhstan (63.1%, a difference of 0.010%), Serbian (63.0%, a difference of 0.010%), Immigrants from Turkey (63.1%, a difference of 0.020%), and Immigrants from Austria (63.1%, a difference of 0.030%). Similarly, the demographic groups most similar to Immigrants from Croatia are Immigrants from Turkey (63.1%, a difference of 0.0%), Immigrants from Austria (63.1%, a difference of 0.010%), Immigrants from Kazakhstan (63.1%, a difference of 0.010%), West Indian (63.1%, a difference of 0.020%), and Immigrants from Singapore (63.1%, a difference of 0.030%).
| Demographics | Rating | Rank | Family Households |
| Immigrants | Ireland | 0.6 /100 | #262 | Tragic 63.2% |
| Cheyenne | 0.5 /100 | #263 | Tragic 63.2% |
| Kenyans | 0.5 /100 | #264 | Tragic 63.2% |
| Colville | 0.5 /100 | #265 | Tragic 63.2% |
| Immigrants | Western Africa | 0.5 /100 | #266 | Tragic 63.1% |
| Israelis | 0.4 /100 | #267 | Tragic 63.1% |
| Immigrants | Singapore | 0.4 /100 | #268 | Tragic 63.1% |
| Yugoslavians | 0.4 /100 | #269 | Tragic 63.1% |
| Immigrants | Austria | 0.3 /100 | #270 | Tragic 63.1% |
| Immigrants | Croatia | 0.3 /100 | #271 | Tragic 63.1% |
| Immigrants | Turkey | 0.3 /100 | #272 | Tragic 63.1% |
| Immigrants | Kazakhstan | 0.3 /100 | #273 | Tragic 63.1% |
| Lumbee | 0.3 /100 | #274 | Tragic 63.1% |
| West Indians | 0.3 /100 | #275 | Tragic 63.1% |
| Serbians | 0.3 /100 | #276 | Tragic 63.0% |
| Ottawa | 0.3 /100 | #277 | Tragic 63.0% |
| Immigrants | Belgium | 0.2 /100 | #278 | Tragic 63.0% |
| Immigrants | Yemen | 0.2 /100 | #279 | Tragic 63.0% |
| Immigrants | Bulgaria | 0.2 /100 | #280 | Tragic 63.0% |
| Estonians | 0.2 /100 | #281 | Tragic 62.9% |
| New Zealanders | 0.1 /100 | #282 | Tragic 62.9% |