Dominican vs Immigrants from Croatia Disability Age Under 5
COMPARE
Dominican
Immigrants from Croatia
Disability Age Under 5
Disability Age Under 5 Comparison
Dominicans
Immigrants from Croatia
1.1%
DISABILITY AGE UNDER 5
96.3/ 100
METRIC RATING
99th/ 347
METRIC RANK
1.3%
DISABILITY AGE UNDER 5
11.2/ 100
METRIC RATING
219th/ 347
METRIC RANK
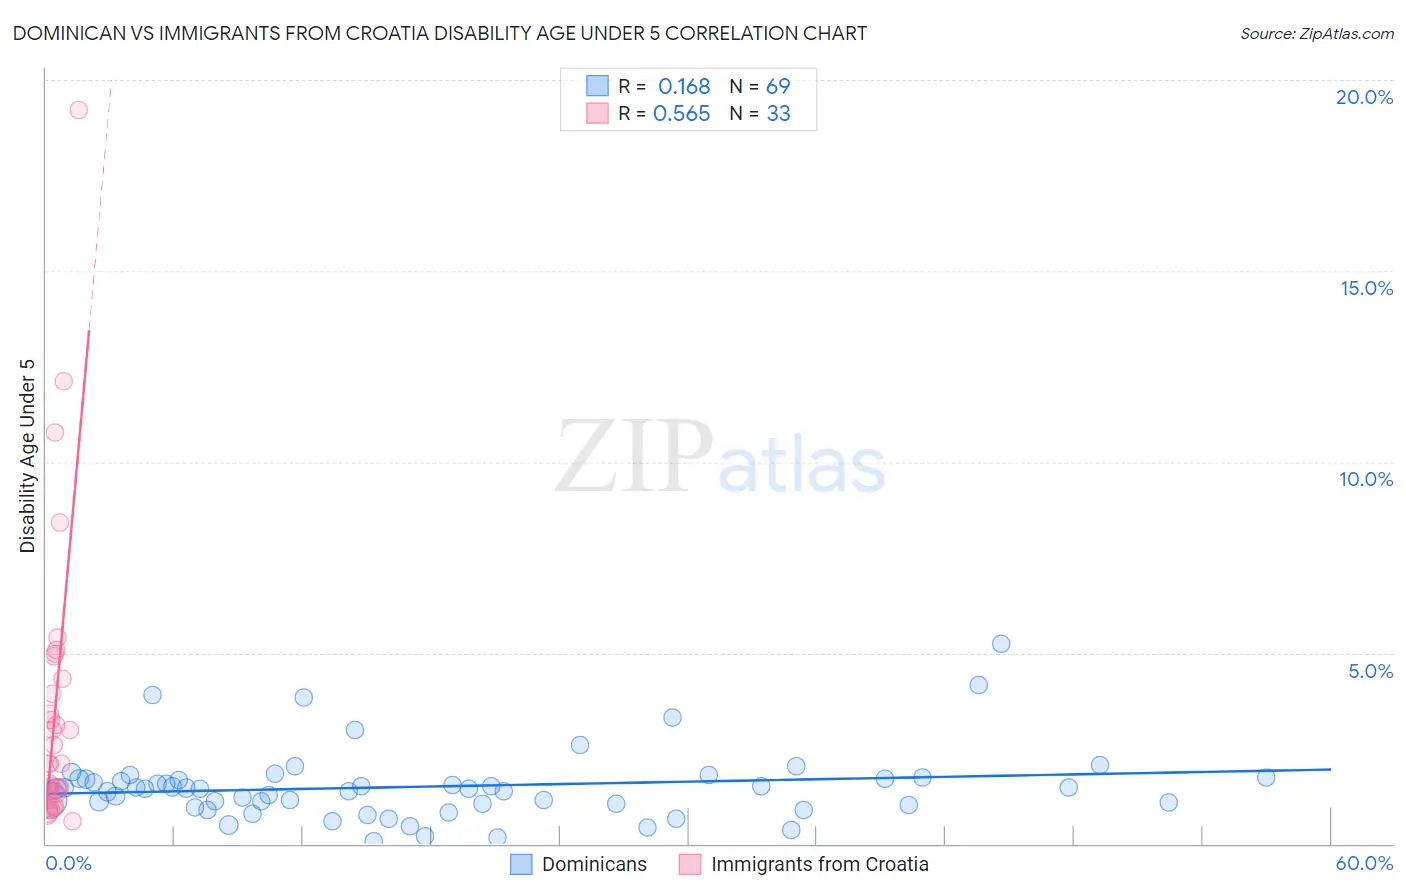
Dominican vs Immigrants from Croatia Disability Age Under 5 Correlation Chart
The statistical analysis conducted on geographies consisting of 197,745,211 people shows a poor positive correlation between the proportion of Dominicans and percentage of population with a disability under the age of 5 in the United States with a correlation coefficient (R) of 0.168 and weighted average of 1.1%. Similarly, the statistical analysis conducted on geographies consisting of 91,296,638 people shows a substantial positive correlation between the proportion of Immigrants from Croatia and percentage of population with a disability under the age of 5 in the United States with a correlation coefficient (R) of 0.565 and weighted average of 1.3%, a difference of 13.0%.
Disability Age Under 5 Correlation Summary
| Measurement | Dominican | Immigrants from Croatia |
| Minimum | 0.058% | 0.59% |
| Maximum | 5.2% | 19.2% |
| Range | 5.2% | 18.6% |
| Mean | 1.5% | 3.6% |
| Median | 1.5% | 2.1% |
| Interquartile 25% (IQ1) | 1.0% | 1.2% |
| Interquartile 75% (IQ3) | 1.7% | 4.6% |
| Interquartile Range (IQR) | 0.68% | 3.4% |
| Standard Deviation (Sample) | 0.92% | 3.9% |
| Standard Deviation (Population) | 0.91% | 3.9% |
Similar Demographics by Disability Age Under 5
Demographics Similar to Dominicans by Disability Age Under 5
In terms of disability age under 5, the demographic groups most similar to Dominicans are Nicaraguan (1.1%, a difference of 0.030%), Immigrants from South Eastern Asia (1.1%, a difference of 0.13%), Immigrants from Iraq (1.1%, a difference of 0.14%), Immigrants from Uganda (1.1%, a difference of 0.14%), and Immigrants from Morocco (1.2%, a difference of 0.20%).
| Demographics | Rating | Rank | Disability Age Under 5 |
| Immigrants | Cuba | 97.0 /100 | #92 | Exceptional 1.1% |
| Spanish Americans | 96.9 /100 | #93 | Exceptional 1.1% |
| Sri Lankans | 96.8 /100 | #94 | Exceptional 1.1% |
| Immigrants | Moldova | 96.8 /100 | #95 | Exceptional 1.1% |
| Mongolians | 96.6 /100 | #96 | Exceptional 1.1% |
| Immigrants | Iraq | 96.5 /100 | #97 | Exceptional 1.1% |
| Immigrants | South Eastern Asia | 96.5 /100 | #98 | Exceptional 1.1% |
| Dominicans | 96.3 /100 | #99 | Exceptional 1.1% |
| Nicaraguans | 96.3 /100 | #100 | Exceptional 1.1% |
| Immigrants | Uganda | 96.1 /100 | #101 | Exceptional 1.1% |
| Immigrants | Morocco | 96.0 /100 | #102 | Exceptional 1.2% |
| Immigrants | Nicaragua | 96.0 /100 | #103 | Exceptional 1.2% |
| Indonesians | 95.9 /100 | #104 | Exceptional 1.2% |
| Immigrants | South Africa | 95.6 /100 | #105 | Exceptional 1.2% |
| Cambodians | 95.4 /100 | #106 | Exceptional 1.2% |
Demographics Similar to Immigrants from Croatia by Disability Age Under 5
In terms of disability age under 5, the demographic groups most similar to Immigrants from Croatia are Serbian (1.3%, a difference of 0.37%), Malaysian (1.3%, a difference of 0.40%), Subsaharan African (1.3%, a difference of 0.71%), Ukrainian (1.3%, a difference of 0.71%), and Cypriot (1.3%, a difference of 0.72%).
| Demographics | Rating | Rank | Disability Age Under 5 |
| Chileans | 18.8 /100 | #212 | Poor 1.3% |
| Immigrants | Sudan | 18.7 /100 | #213 | Poor 1.3% |
| Immigrants | Chile | 17.2 /100 | #214 | Poor 1.3% |
| Syrians | 16.1 /100 | #215 | Poor 1.3% |
| Bangladeshis | 15.5 /100 | #216 | Poor 1.3% |
| Cypriots | 14.9 /100 | #217 | Poor 1.3% |
| Malaysians | 13.2 /100 | #218 | Poor 1.3% |
| Immigrants | Croatia | 11.2 /100 | #219 | Poor 1.3% |
| Serbians | 9.6 /100 | #220 | Tragic 1.3% |
| Sub-Saharan Africans | 8.3 /100 | #221 | Tragic 1.3% |
| Ukrainians | 8.3 /100 | #222 | Tragic 1.3% |
| Hispanics or Latinos | 7.7 /100 | #223 | Tragic 1.3% |
| Latvians | 7.1 /100 | #224 | Tragic 1.3% |
| Panamanians | 7.1 /100 | #225 | Tragic 1.3% |
| Bahamians | 7.1 /100 | #226 | Tragic 1.3% |