Lumbee vs Immigrants from Dominican Republic Self-Care Disability
COMPARE
Lumbee
Immigrants from Dominican Republic
Self-Care Disability
Self-Care Disability Comparison
Lumbee
Immigrants from Dominican Republic
3.0%
SELF-CARE DISABILITY
0.0/ 100
METRIC RATING
331st/ 347
METRIC RANK
3.0%
SELF-CARE DISABILITY
0.0/ 100
METRIC RATING
339th/ 347
METRIC RANK
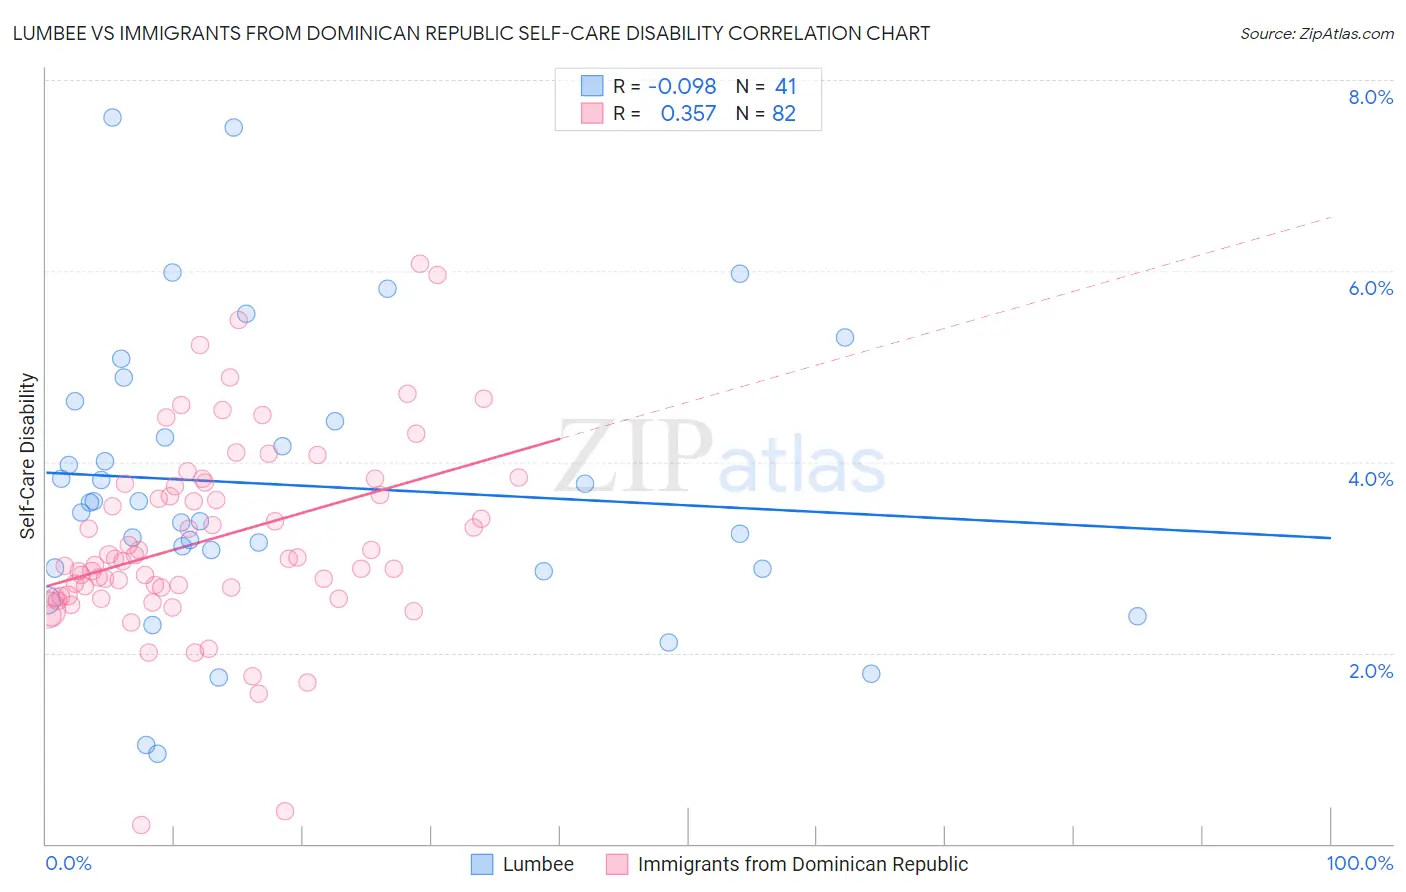
Lumbee vs Immigrants from Dominican Republic Self-Care Disability Correlation Chart
The statistical analysis conducted on geographies consisting of 92,217,287 people shows a slight negative correlation between the proportion of Lumbee and percentage of population with self-care disability in the United States with a correlation coefficient (R) of -0.098 and weighted average of 3.0%. Similarly, the statistical analysis conducted on geographies consisting of 274,850,038 people shows a mild positive correlation between the proportion of Immigrants from Dominican Republic and percentage of population with self-care disability in the United States with a correlation coefficient (R) of 0.357 and weighted average of 3.0%, a difference of 2.7%.
Self-Care Disability Correlation Summary
| Measurement | Lumbee | Immigrants from Dominican Republic |
| Minimum | 0.94% | 0.19% |
| Maximum | 7.6% | 6.1% |
| Range | 6.7% | 5.9% |
| Mean | 3.8% | 3.2% |
| Median | 3.6% | 3.0% |
| Interquartile 25% (IQ1) | 2.9% | 2.6% |
| Interquartile 75% (IQ3) | 4.5% | 3.8% |
| Interquartile Range (IQR) | 1.6% | 1.2% |
| Standard Deviation (Sample) | 1.5% | 1.0% |
| Standard Deviation (Population) | 1.5% | 1.0% |
Demographics Similar to Lumbee and Immigrants from Dominican Republic by Self-Care Disability
In terms of self-care disability, the demographic groups most similar to Lumbee are Nepalese (3.0%, a difference of 0.12%), Kiowa (3.0%, a difference of 0.36%), Dutch West Indian (3.0%, a difference of 0.59%), Houma (3.0%, a difference of 0.66%), and Immigrants from the Azores (3.0%, a difference of 0.71%). Similarly, the demographic groups most similar to Immigrants from Dominican Republic are Immigrants from Cabo Verde (3.1%, a difference of 0.33%), Cape Verdean (3.0%, a difference of 0.38%), Dominican (3.1%, a difference of 0.59%), Choctaw (3.0%, a difference of 0.69%), and Immigrants from Yemen (3.0%, a difference of 1.8%).
| Demographics | Rating | Rank | Self-Care Disability |
| Immigrants | Uzbekistan | 0.0 /100 | #325 | Tragic 2.9% |
| Paiute | 0.0 /100 | #326 | Tragic 2.9% |
| Blacks/African Americans | 0.0 /100 | #327 | Tragic 2.9% |
| Hopi | 0.0 /100 | #328 | Tragic 2.9% |
| Cajuns | 0.0 /100 | #329 | Tragic 2.9% |
| Nepalese | 0.0 /100 | #330 | Tragic 3.0% |
| Lumbee | 0.0 /100 | #331 | Tragic 3.0% |
| Kiowa | 0.0 /100 | #332 | Tragic 3.0% |
| Dutch West Indians | 0.0 /100 | #333 | Tragic 3.0% |
| Houma | 0.0 /100 | #334 | Tragic 3.0% |
| Immigrants | Azores | 0.0 /100 | #335 | Tragic 3.0% |
| Immigrants | Yemen | 0.0 /100 | #336 | Tragic 3.0% |
| Choctaw | 0.0 /100 | #337 | Tragic 3.0% |
| Cape Verdeans | 0.0 /100 | #338 | Tragic 3.0% |
| Immigrants | Dominican Republic | 0.0 /100 | #339 | Tragic 3.0% |
| Immigrants | Cabo Verde | 0.0 /100 | #340 | Tragic 3.1% |
| Dominicans | 0.0 /100 | #341 | Tragic 3.1% |
| Colville | 0.0 /100 | #342 | Tragic 3.1% |
| Tohono O'odham | 0.0 /100 | #343 | Tragic 3.1% |
| Pueblo | 0.0 /100 | #344 | Tragic 3.3% |
| Armenians | 0.0 /100 | #345 | Tragic 3.4% |