Lumbee vs Inupiat Self-Care Disability
COMPARE
Lumbee
Inupiat
Self-Care Disability
Self-Care Disability Comparison
Lumbee
Inupiat
3.0%
SELF-CARE DISABILITY
0.0/ 100
METRIC RATING
331st/ 347
METRIC RANK
2.2%
SELF-CARE DISABILITY
99.9/ 100
METRIC RATING
28th/ 347
METRIC RANK
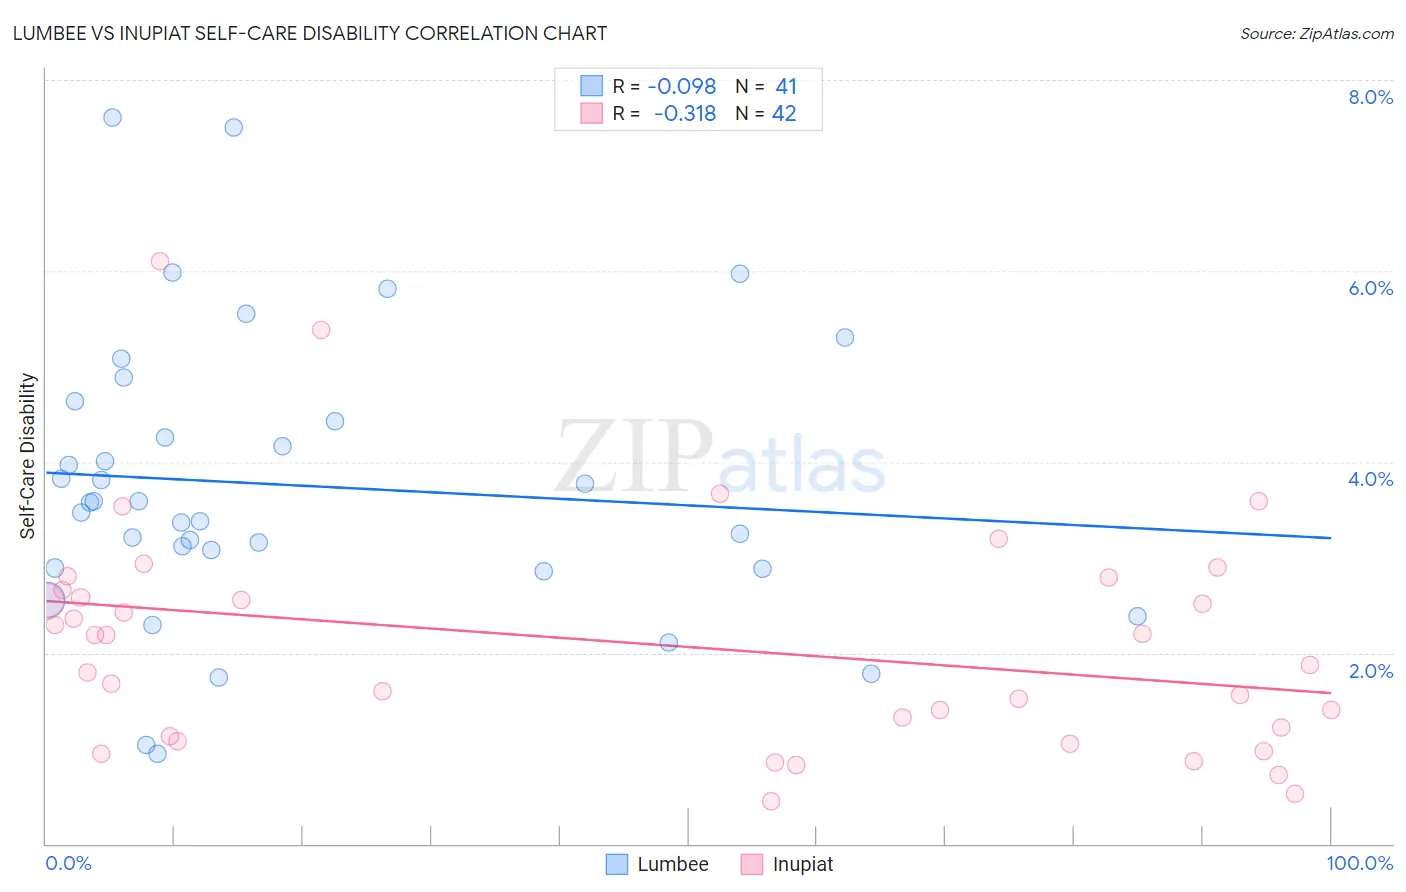
Lumbee vs Inupiat Self-Care Disability Correlation Chart
The statistical analysis conducted on geographies consisting of 92,217,287 people shows a slight negative correlation between the proportion of Lumbee and percentage of population with self-care disability in the United States with a correlation coefficient (R) of -0.098 and weighted average of 3.0%. Similarly, the statistical analysis conducted on geographies consisting of 96,290,518 people shows a mild negative correlation between the proportion of Inupiat and percentage of population with self-care disability in the United States with a correlation coefficient (R) of -0.318 and weighted average of 2.2%, a difference of 31.9%.
Self-Care Disability Correlation Summary
| Measurement | Lumbee | Inupiat |
| Minimum | 0.94% | 0.45% |
| Maximum | 7.6% | 6.1% |
| Range | 6.7% | 5.7% |
| Mean | 3.8% | 2.1% |
| Median | 3.6% | 2.0% |
| Interquartile 25% (IQ1) | 2.9% | 1.1% |
| Interquartile 75% (IQ3) | 4.5% | 2.7% |
| Interquartile Range (IQR) | 1.6% | 1.5% |
| Standard Deviation (Sample) | 1.5% | 1.2% |
| Standard Deviation (Population) | 1.5% | 1.2% |
Similar Demographics by Self-Care Disability
Demographics Similar to Lumbee by Self-Care Disability
In terms of self-care disability, the demographic groups most similar to Lumbee are Nepalese (3.0%, a difference of 0.12%), Kiowa (3.0%, a difference of 0.36%), Dutch West Indian (3.0%, a difference of 0.59%), Houma (3.0%, a difference of 0.66%), and Immigrants from the Azores (3.0%, a difference of 0.71%).
| Demographics | Rating | Rank | Self-Care Disability |
| Cherokee | 0.0 /100 | #324 | Tragic 2.9% |
| Immigrants | Uzbekistan | 0.0 /100 | #325 | Tragic 2.9% |
| Paiute | 0.0 /100 | #326 | Tragic 2.9% |
| Blacks/African Americans | 0.0 /100 | #327 | Tragic 2.9% |
| Hopi | 0.0 /100 | #328 | Tragic 2.9% |
| Cajuns | 0.0 /100 | #329 | Tragic 2.9% |
| Nepalese | 0.0 /100 | #330 | Tragic 3.0% |
| Lumbee | 0.0 /100 | #331 | Tragic 3.0% |
| Kiowa | 0.0 /100 | #332 | Tragic 3.0% |
| Dutch West Indians | 0.0 /100 | #333 | Tragic 3.0% |
| Houma | 0.0 /100 | #334 | Tragic 3.0% |
| Immigrants | Azores | 0.0 /100 | #335 | Tragic 3.0% |
| Immigrants | Yemen | 0.0 /100 | #336 | Tragic 3.0% |
| Choctaw | 0.0 /100 | #337 | Tragic 3.0% |
| Cape Verdeans | 0.0 /100 | #338 | Tragic 3.0% |
Demographics Similar to Inupiat by Self-Care Disability
In terms of self-care disability, the demographic groups most similar to Inupiat are Immigrants from Zimbabwe (2.3%, a difference of 0.090%), Venezuelan (2.2%, a difference of 0.16%), Immigrants from Sri Lanka (2.2%, a difference of 0.17%), Turkish (2.2%, a difference of 0.24%), and Cypriot (2.2%, a difference of 0.35%).
| Demographics | Rating | Rank | Self-Care Disability |
| Bulgarians | 100.0 /100 | #21 | Exceptional 2.2% |
| Immigrants | Venezuela | 100.0 /100 | #22 | Exceptional 2.2% |
| Cambodians | 100.0 /100 | #23 | Exceptional 2.2% |
| Cypriots | 100.0 /100 | #24 | Exceptional 2.2% |
| Turks | 100.0 /100 | #25 | Exceptional 2.2% |
| Immigrants | Sri Lanka | 99.9 /100 | #26 | Exceptional 2.2% |
| Venezuelans | 99.9 /100 | #27 | Exceptional 2.2% |
| Inupiat | 99.9 /100 | #28 | Exceptional 2.2% |
| Immigrants | Zimbabwe | 99.9 /100 | #29 | Exceptional 2.3% |
| Paraguayans | 99.9 /100 | #30 | Exceptional 2.3% |
| Danes | 99.9 /100 | #31 | Exceptional 2.3% |
| Burmese | 99.9 /100 | #32 | Exceptional 2.3% |
| Immigrants | Korea | 99.9 /100 | #33 | Exceptional 2.3% |
| Immigrants | Turkey | 99.9 /100 | #34 | Exceptional 2.3% |
| Immigrants | Australia | 99.9 /100 | #35 | Exceptional 2.3% |