Lumbee vs Bangladeshi Self-Care Disability
COMPARE
Lumbee
Bangladeshi
Self-Care Disability
Self-Care Disability Comparison
Lumbee
Bangladeshis
3.0%
SELF-CARE DISABILITY
0.0/ 100
METRIC RATING
331st/ 347
METRIC RANK
2.8%
SELF-CARE DISABILITY
0.0/ 100
METRIC RATING
309th/ 347
METRIC RANK
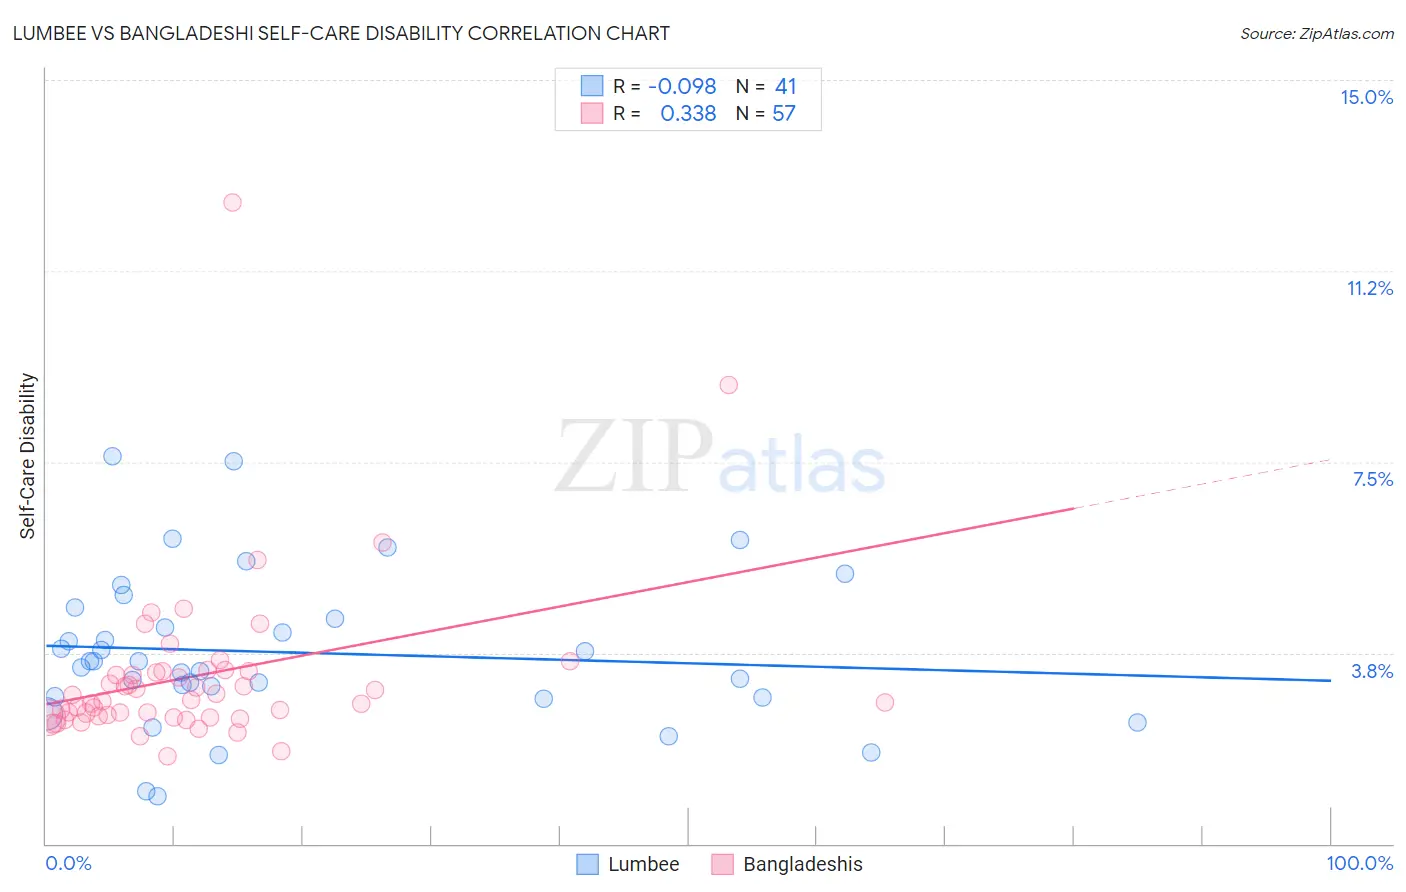
Lumbee vs Bangladeshi Self-Care Disability Correlation Chart
The statistical analysis conducted on geographies consisting of 92,217,287 people shows a slight negative correlation between the proportion of Lumbee and percentage of population with self-care disability in the United States with a correlation coefficient (R) of -0.098 and weighted average of 3.0%. Similarly, the statistical analysis conducted on geographies consisting of 141,272,770 people shows a mild positive correlation between the proportion of Bangladeshis and percentage of population with self-care disability in the United States with a correlation coefficient (R) of 0.338 and weighted average of 2.8%, a difference of 5.3%.
Self-Care Disability Correlation Summary
| Measurement | Lumbee | Bangladeshi |
| Minimum | 0.94% | 1.7% |
| Maximum | 7.6% | 12.6% |
| Range | 6.7% | 10.9% |
| Mean | 3.8% | 3.3% |
| Median | 3.6% | 2.8% |
| Interquartile 25% (IQ1) | 2.9% | 2.5% |
| Interquartile 75% (IQ3) | 4.5% | 3.4% |
| Interquartile Range (IQR) | 1.6% | 0.90% |
| Standard Deviation (Sample) | 1.5% | 1.7% |
| Standard Deviation (Population) | 1.5% | 1.7% |
Similar Demographics by Self-Care Disability
Demographics Similar to Lumbee by Self-Care Disability
In terms of self-care disability, the demographic groups most similar to Lumbee are Nepalese (3.0%, a difference of 0.12%), Kiowa (3.0%, a difference of 0.36%), Dutch West Indian (3.0%, a difference of 0.59%), Houma (3.0%, a difference of 0.66%), and Immigrants from the Azores (3.0%, a difference of 0.71%).
| Demographics | Rating | Rank | Self-Care Disability |
| Cherokee | 0.0 /100 | #324 | Tragic 2.9% |
| Immigrants | Uzbekistan | 0.0 /100 | #325 | Tragic 2.9% |
| Paiute | 0.0 /100 | #326 | Tragic 2.9% |
| Blacks/African Americans | 0.0 /100 | #327 | Tragic 2.9% |
| Hopi | 0.0 /100 | #328 | Tragic 2.9% |
| Cajuns | 0.0 /100 | #329 | Tragic 2.9% |
| Nepalese | 0.0 /100 | #330 | Tragic 3.0% |
| Lumbee | 0.0 /100 | #331 | Tragic 3.0% |
| Kiowa | 0.0 /100 | #332 | Tragic 3.0% |
| Dutch West Indians | 0.0 /100 | #333 | Tragic 3.0% |
| Houma | 0.0 /100 | #334 | Tragic 3.0% |
| Immigrants | Azores | 0.0 /100 | #335 | Tragic 3.0% |
| Immigrants | Yemen | 0.0 /100 | #336 | Tragic 3.0% |
| Choctaw | 0.0 /100 | #337 | Tragic 3.0% |
| Cape Verdeans | 0.0 /100 | #338 | Tragic 3.0% |
Demographics Similar to Bangladeshis by Self-Care Disability
In terms of self-care disability, the demographic groups most similar to Bangladeshis are British West Indian (2.8%, a difference of 0.10%), Immigrants from Grenada (2.8%, a difference of 0.15%), Puget Sound Salish (2.8%, a difference of 0.17%), Immigrants from Caribbean (2.8%, a difference of 0.36%), and Spanish American (2.8%, a difference of 0.40%).
| Demographics | Rating | Rank | Self-Care Disability |
| Immigrants | St. Vincent and the Grenadines | 0.0 /100 | #302 | Tragic 2.8% |
| Immigrants | Belize | 0.0 /100 | #303 | Tragic 2.8% |
| Cree | 0.0 /100 | #304 | Tragic 2.8% |
| Immigrants | West Indies | 0.0 /100 | #305 | Tragic 2.8% |
| Aleuts | 0.0 /100 | #306 | Tragic 2.8% |
| Natives/Alaskans | 0.0 /100 | #307 | Tragic 2.8% |
| Immigrants | Grenada | 0.0 /100 | #308 | Tragic 2.8% |
| Bangladeshis | 0.0 /100 | #309 | Tragic 2.8% |
| British West Indians | 0.0 /100 | #310 | Tragic 2.8% |
| Puget Sound Salish | 0.0 /100 | #311 | Tragic 2.8% |
| Immigrants | Caribbean | 0.0 /100 | #312 | Tragic 2.8% |
| Spanish Americans | 0.0 /100 | #313 | Tragic 2.8% |
| Creek | 0.0 /100 | #314 | Tragic 2.8% |
| Immigrants | Cuba | 0.0 /100 | #315 | Tragic 2.8% |
| Menominee | 0.0 /100 | #316 | Tragic 2.8% |