Lithuanian vs Seminole Hearing Disability
COMPARE
Lithuanian
Seminole
Hearing Disability
Hearing Disability Comparison
Lithuanians
Seminole
3.4%
HEARING DISABILITY
0.6/ 100
METRIC RATING
247th/ 347
METRIC RANK
4.1%
HEARING DISABILITY
0.0/ 100
METRIC RATING
322nd/ 347
METRIC RANK
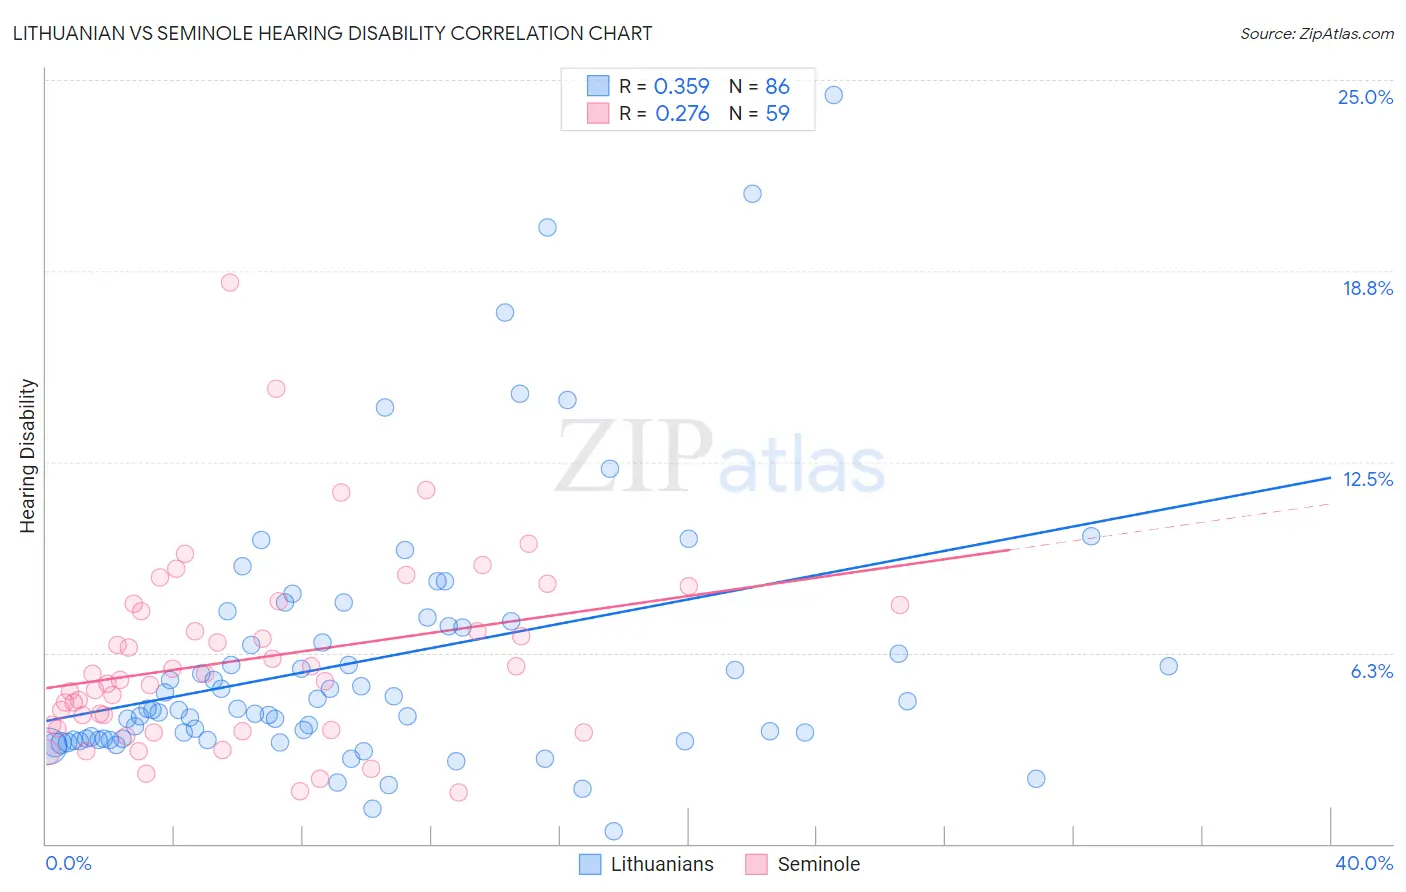
Lithuanian vs Seminole Hearing Disability Correlation Chart
The statistical analysis conducted on geographies consisting of 421,806,281 people shows a mild positive correlation between the proportion of Lithuanians and percentage of population with hearing disability in the United States with a correlation coefficient (R) of 0.359 and weighted average of 3.4%. Similarly, the statistical analysis conducted on geographies consisting of 118,281,320 people shows a weak positive correlation between the proportion of Seminole and percentage of population with hearing disability in the United States with a correlation coefficient (R) of 0.276 and weighted average of 4.1%, a difference of 21.9%.
Hearing Disability Correlation Summary
| Measurement | Lithuanian | Seminole |
| Minimum | 0.40% | 1.7% |
| Maximum | 24.5% | 18.4% |
| Range | 24.1% | 16.7% |
| Mean | 6.0% | 6.0% |
| Median | 4.4% | 5.4% |
| Interquartile 25% (IQ1) | 3.4% | 3.8% |
| Interquartile 75% (IQ3) | 7.1% | 7.8% |
| Interquartile Range (IQR) | 3.7% | 4.0% |
| Standard Deviation (Sample) | 4.4% | 3.1% |
| Standard Deviation (Population) | 4.3% | 3.1% |
Similar Demographics by Hearing Disability
Demographics Similar to Lithuanians by Hearing Disability
In terms of hearing disability, the demographic groups most similar to Lithuanians are Immigrants from England (3.3%, a difference of 0.20%), Austrian (3.4%, a difference of 0.22%), Immigrants from Scotland (3.3%, a difference of 0.48%), Italian (3.4%, a difference of 0.75%), and Yuman (3.4%, a difference of 0.76%).
| Demographics | Rating | Rank | Hearing Disability |
| Immigrants | Netherlands | 1.1 /100 | #240 | Tragic 3.3% |
| Samoans | 1.1 /100 | #241 | Tragic 3.3% |
| Yugoslavians | 1.0 /100 | #242 | Tragic 3.3% |
| Immigrants | Western Europe | 1.0 /100 | #243 | Tragic 3.3% |
| Assyrians/Chaldeans/Syriacs | 0.9 /100 | #244 | Tragic 3.3% |
| Immigrants | Scotland | 0.8 /100 | #245 | Tragic 3.3% |
| Immigrants | England | 0.7 /100 | #246 | Tragic 3.3% |
| Lithuanians | 0.6 /100 | #247 | Tragic 3.4% |
| Austrians | 0.6 /100 | #248 | Tragic 3.4% |
| Italians | 0.4 /100 | #249 | Tragic 3.4% |
| Yuman | 0.4 /100 | #250 | Tragic 3.4% |
| Hungarians | 0.4 /100 | #251 | Tragic 3.4% |
| Croatians | 0.4 /100 | #252 | Tragic 3.4% |
| Carpatho Rusyns | 0.3 /100 | #253 | Tragic 3.4% |
| Slavs | 0.2 /100 | #254 | Tragic 3.4% |
Demographics Similar to Seminole by Hearing Disability
In terms of hearing disability, the demographic groups most similar to Seminole are Apache (4.1%, a difference of 0.12%), Osage (4.1%, a difference of 0.19%), Paiute (4.1%, a difference of 0.26%), Lumbee (4.1%, a difference of 0.51%), and Potawatomi (4.1%, a difference of 0.80%).
| Demographics | Rating | Rank | Hearing Disability |
| Puget Sound Salish | 0.0 /100 | #315 | Tragic 3.9% |
| Spanish Americans | 0.0 /100 | #316 | Tragic 4.0% |
| Comanche | 0.0 /100 | #317 | Tragic 4.0% |
| Cheyenne | 0.0 /100 | #318 | Tragic 4.0% |
| Chippewa | 0.0 /100 | #319 | Tragic 4.0% |
| Shoshone | 0.0 /100 | #320 | Tragic 4.0% |
| Paiute | 0.0 /100 | #321 | Tragic 4.1% |
| Seminole | 0.0 /100 | #322 | Tragic 4.1% |
| Apache | 0.0 /100 | #323 | Tragic 4.1% |
| Osage | 0.0 /100 | #324 | Tragic 4.1% |
| Lumbee | 0.0 /100 | #325 | Tragic 4.1% |
| Potawatomi | 0.0 /100 | #326 | Tragic 4.1% |
| Arapaho | 0.0 /100 | #327 | Tragic 4.1% |
| Tohono O'odham | 0.0 /100 | #328 | Tragic 4.2% |
| Crow | 0.0 /100 | #329 | Tragic 4.2% |