Lithuanian vs Menominee Currently Married
COMPARE
Lithuanian
Menominee
Currently Married
Currently Married Comparison
Lithuanians
Menominee
49.0%
CURRENTLY MARRIED
99.6/ 100
METRIC RATING
24th/ 347
METRIC RANK
42.3%
CURRENTLY MARRIED
0.0/ 100
METRIC RATING
296th/ 347
METRIC RANK
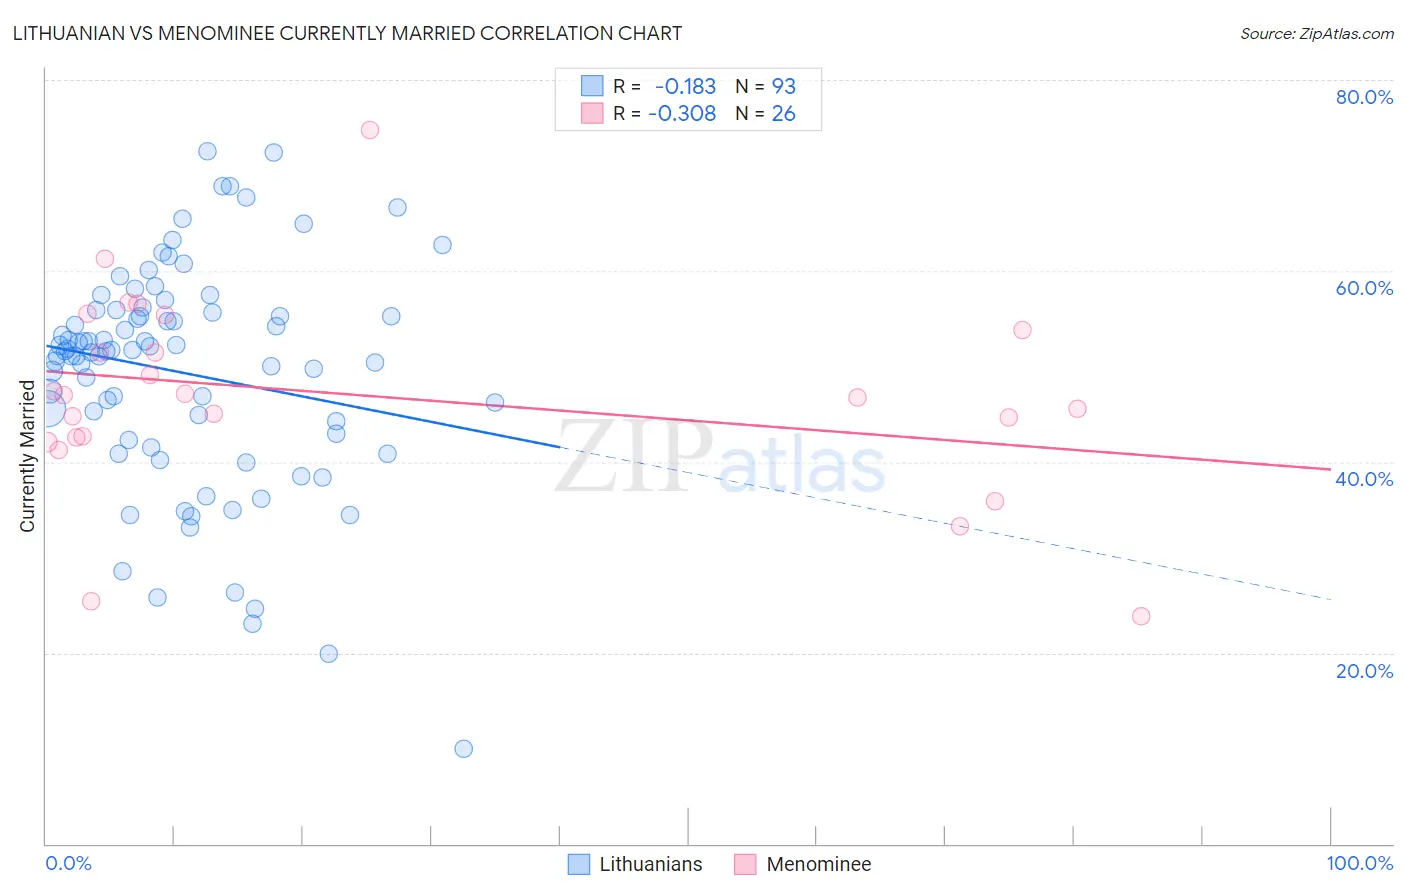
Lithuanian vs Menominee Currently Married Correlation Chart
The statistical analysis conducted on geographies consisting of 421,888,546 people shows a poor negative correlation between the proportion of Lithuanians and percentage of population currently married in the United States with a correlation coefficient (R) of -0.183 and weighted average of 49.0%. Similarly, the statistical analysis conducted on geographies consisting of 45,778,979 people shows a mild negative correlation between the proportion of Menominee and percentage of population currently married in the United States with a correlation coefficient (R) of -0.308 and weighted average of 42.3%, a difference of 15.9%.
Currently Married Correlation Summary
| Measurement | Lithuanian | Menominee |
| Minimum | 10.0% | 23.8% |
| Maximum | 72.5% | 74.8% |
| Range | 62.5% | 51.0% |
| Mean | 49.3% | 47.0% |
| Median | 51.6% | 46.8% |
| Interquartile 25% (IQ1) | 42.6% | 42.5% |
| Interquartile 75% (IQ3) | 55.8% | 53.8% |
| Interquartile Range (IQR) | 13.2% | 11.3% |
| Standard Deviation (Sample) | 11.7% | 10.6% |
| Standard Deviation (Population) | 11.7% | 10.4% |
Similar Demographics by Currently Married
Demographics Similar to Lithuanians by Currently Married
In terms of currently married, the demographic groups most similar to Lithuanians are Maltese (49.0%, a difference of 0.010%), Immigrants from Korea (49.0%, a difference of 0.060%), Immigrants from Pakistan (49.1%, a difference of 0.11%), Burmese (48.9%, a difference of 0.13%), and Welsh (48.9%, a difference of 0.17%).
| Demographics | Rating | Rank | Currently Married |
| Scandinavians | 99.9 /100 | #17 | Exceptional 49.5% |
| Immigrants | Scotland | 99.8 /100 | #18 | Exceptional 49.3% |
| Europeans | 99.8 /100 | #19 | Exceptional 49.3% |
| Luxembourgers | 99.8 /100 | #20 | Exceptional 49.3% |
| Scottish | 99.8 /100 | #21 | Exceptional 49.2% |
| Bulgarians | 99.7 /100 | #22 | Exceptional 49.1% |
| Immigrants | Pakistan | 99.7 /100 | #23 | Exceptional 49.1% |
| Lithuanians | 99.6 /100 | #24 | Exceptional 49.0% |
| Maltese | 99.6 /100 | #25 | Exceptional 49.0% |
| Immigrants | Korea | 99.6 /100 | #26 | Exceptional 49.0% |
| Burmese | 99.6 /100 | #27 | Exceptional 48.9% |
| Welsh | 99.5 /100 | #28 | Exceptional 48.9% |
| Croatians | 99.5 /100 | #29 | Exceptional 48.9% |
| Eastern Europeans | 99.5 /100 | #30 | Exceptional 48.9% |
| Poles | 99.5 /100 | #31 | Exceptional 48.9% |
Demographics Similar to Menominee by Currently Married
In terms of currently married, the demographic groups most similar to Menominee are Cheyenne (42.2%, a difference of 0.11%), Immigrants from Honduras (42.2%, a difference of 0.20%), Immigrants from Western Africa (42.4%, a difference of 0.21%), Liberian (42.2%, a difference of 0.23%), and Belizean (42.2%, a difference of 0.33%).
| Demographics | Rating | Rank | Currently Married |
| Paiute | 0.0 /100 | #289 | Tragic 42.7% |
| Immigrants | Ghana | 0.0 /100 | #290 | Tragic 42.7% |
| Immigrants | Guatemala | 0.0 /100 | #291 | Tragic 42.6% |
| Sub-Saharan Africans | 0.0 /100 | #292 | Tragic 42.6% |
| Yuman | 0.0 /100 | #293 | Tragic 42.6% |
| Hondurans | 0.0 /100 | #294 | Tragic 42.5% |
| Immigrants | Western Africa | 0.0 /100 | #295 | Tragic 42.4% |
| Menominee | 0.0 /100 | #296 | Tragic 42.3% |
| Cheyenne | 0.0 /100 | #297 | Tragic 42.2% |
| Immigrants | Honduras | 0.0 /100 | #298 | Tragic 42.2% |
| Liberians | 0.0 /100 | #299 | Tragic 42.2% |
| Belizeans | 0.0 /100 | #300 | Tragic 42.2% |
| Immigrants | Yemen | 0.0 /100 | #301 | Tragic 42.1% |
| Immigrants | Zaire | 0.0 /100 | #302 | Tragic 42.0% |
| Sioux | 0.0 /100 | #303 | Tragic 41.9% |