Fijian vs Immigrants from Croatia Female Disability
COMPARE
Fijian
Immigrants from Croatia
Female Disability
Female Disability Comparison
Fijians
Immigrants from Croatia
13.1%
FEMALE DISABILITY
0.0/ 100
METRIC RATING
286th/ 347
METRIC RANK
11.8%
FEMALE DISABILITY
96.7/ 100
METRIC RATING
123rd/ 347
METRIC RANK
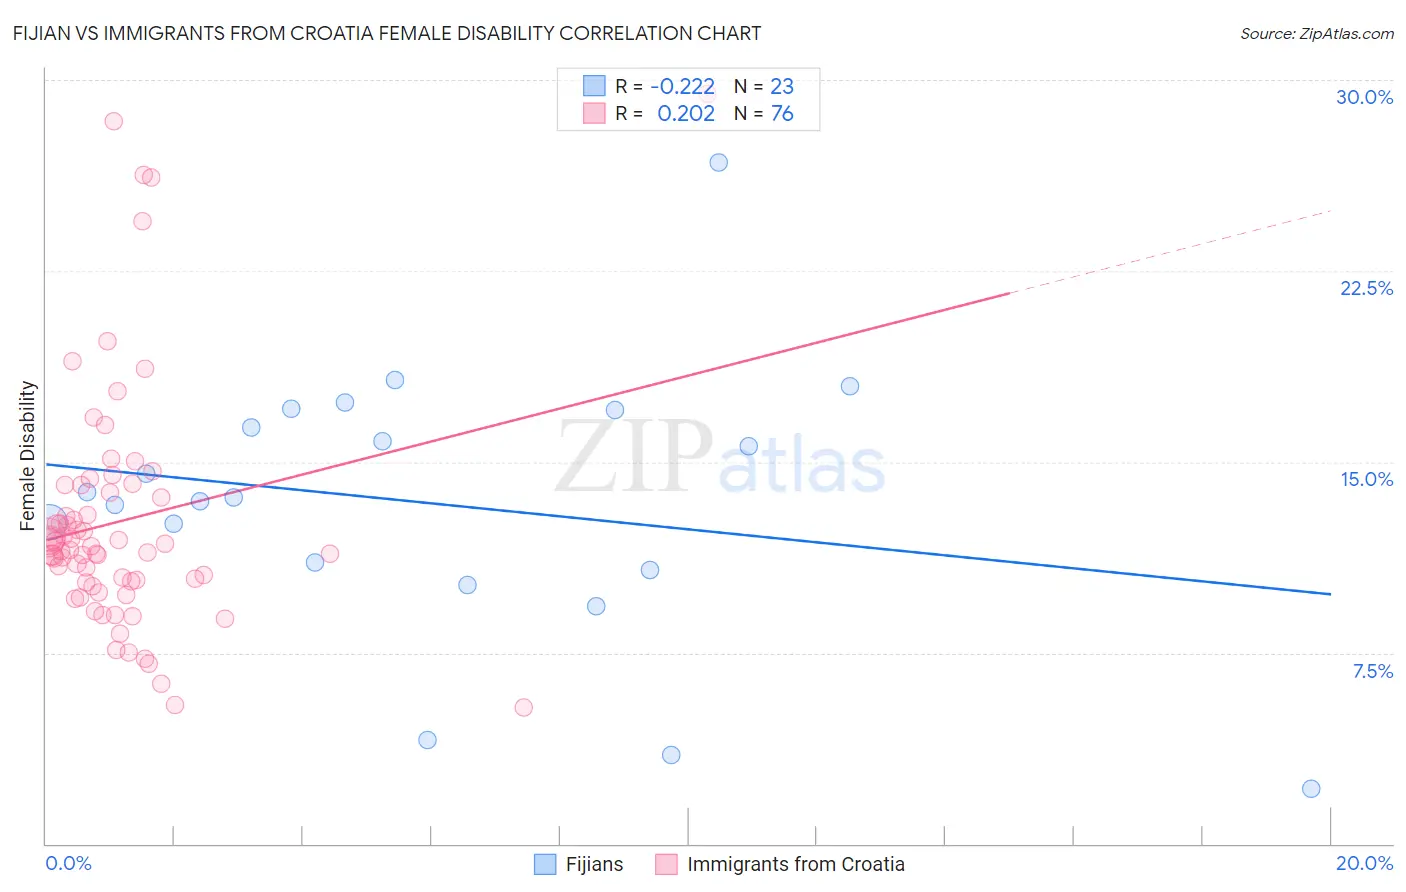
Fijian vs Immigrants from Croatia Female Disability Correlation Chart
The statistical analysis conducted on geographies consisting of 55,947,462 people shows a weak negative correlation between the proportion of Fijians and percentage of females with a disability in the United States with a correlation coefficient (R) of -0.222 and weighted average of 13.1%. Similarly, the statistical analysis conducted on geographies consisting of 132,577,036 people shows a weak positive correlation between the proportion of Immigrants from Croatia and percentage of females with a disability in the United States with a correlation coefficient (R) of 0.202 and weighted average of 11.8%, a difference of 11.0%.
Female Disability Correlation Summary
| Measurement | Fijian | Immigrants from Croatia |
| Minimum | 2.2% | 5.3% |
| Maximum | 26.8% | 29.4% |
| Range | 24.6% | 24.1% |
| Mean | 13.4% | 12.7% |
| Median | 13.6% | 11.6% |
| Interquartile 25% (IQ1) | 10.8% | 10.3% |
| Interquartile 75% (IQ3) | 17.0% | 13.9% |
| Interquartile Range (IQR) | 6.3% | 3.6% |
| Standard Deviation (Sample) | 5.4% | 4.8% |
| Standard Deviation (Population) | 5.3% | 4.7% |
Similar Demographics by Female Disability
Demographics Similar to Fijians by Female Disability
In terms of female disability, the demographic groups most similar to Fijians are Bangladeshi (13.1%, a difference of 0.050%), Hmong (13.1%, a difference of 0.10%), English (13.1%, a difference of 0.23%), Welsh (13.1%, a difference of 0.24%), and U.S. Virgin Islander (13.1%, a difference of 0.32%).
| Demographics | Rating | Rank | Female Disability |
| Arapaho | 0.1 /100 | #279 | Tragic 13.0% |
| Irish | 0.1 /100 | #280 | Tragic 13.1% |
| U.S. Virgin Islanders | 0.1 /100 | #281 | Tragic 13.1% |
| Welsh | 0.0 /100 | #282 | Tragic 13.1% |
| English | 0.0 /100 | #283 | Tragic 13.1% |
| Hmong | 0.0 /100 | #284 | Tragic 13.1% |
| Bangladeshis | 0.0 /100 | #285 | Tragic 13.1% |
| Fijians | 0.0 /100 | #286 | Tragic 13.1% |
| Yaqui | 0.0 /100 | #287 | Tragic 13.2% |
| Whites/Caucasians | 0.0 /100 | #288 | Tragic 13.2% |
| Tlingit-Haida | 0.0 /100 | #289 | Tragic 13.2% |
| Immigrants | Yemen | 0.0 /100 | #290 | Tragic 13.2% |
| Shoshone | 0.0 /100 | #291 | Tragic 13.2% |
| Yakama | 0.0 /100 | #292 | Tragic 13.2% |
| Marshallese | 0.0 /100 | #293 | Tragic 13.3% |
Demographics Similar to Immigrants from Croatia by Female Disability
In terms of female disability, the demographic groups most similar to Immigrants from Croatia are Immigrants from North Macedonia (11.8%, a difference of 0.050%), Russian (11.8%, a difference of 0.050%), Immigrants from Netherlands (11.8%, a difference of 0.060%), Immigrants from Italy (11.8%, a difference of 0.070%), and Immigrants from Kazakhstan (11.8%, a difference of 0.090%).
| Demographics | Rating | Rank | Female Disability |
| Immigrants | Morocco | 97.6 /100 | #116 | Exceptional 11.8% |
| Immigrants | Eastern Europe | 97.2 /100 | #117 | Exceptional 11.8% |
| Immigrants | Nigeria | 97.2 /100 | #118 | Exceptional 11.8% |
| Immigrants | Uganda | 97.2 /100 | #119 | Exceptional 11.8% |
| Immigrants | Kazakhstan | 97.0 /100 | #120 | Exceptional 11.8% |
| Immigrants | Netherlands | 96.9 /100 | #121 | Exceptional 11.8% |
| Immigrants | North Macedonia | 96.8 /100 | #122 | Exceptional 11.8% |
| Immigrants | Croatia | 96.7 /100 | #123 | Exceptional 11.8% |
| Russians | 96.5 /100 | #124 | Exceptional 11.8% |
| Immigrants | Italy | 96.4 /100 | #125 | Exceptional 11.8% |
| Immigrants | Europe | 96.2 /100 | #126 | Exceptional 11.8% |
| South American Indians | 95.8 /100 | #127 | Exceptional 11.8% |
| Immigrants | Latvia | 95.6 /100 | #128 | Exceptional 11.8% |
| Macedonians | 95.5 /100 | #129 | Exceptional 11.8% |
| Nicaraguans | 95.2 /100 | #130 | Exceptional 11.9% |