Potawatomi vs Immigrants from Croatia Female Disability
COMPARE
Potawatomi
Immigrants from Croatia
Female Disability
Female Disability Comparison
Potawatomi
Immigrants from Croatia
14.1%
FEMALE DISABILITY
0.0/ 100
METRIC RATING
321st/ 347
METRIC RANK
11.8%
FEMALE DISABILITY
96.7/ 100
METRIC RATING
123rd/ 347
METRIC RANK
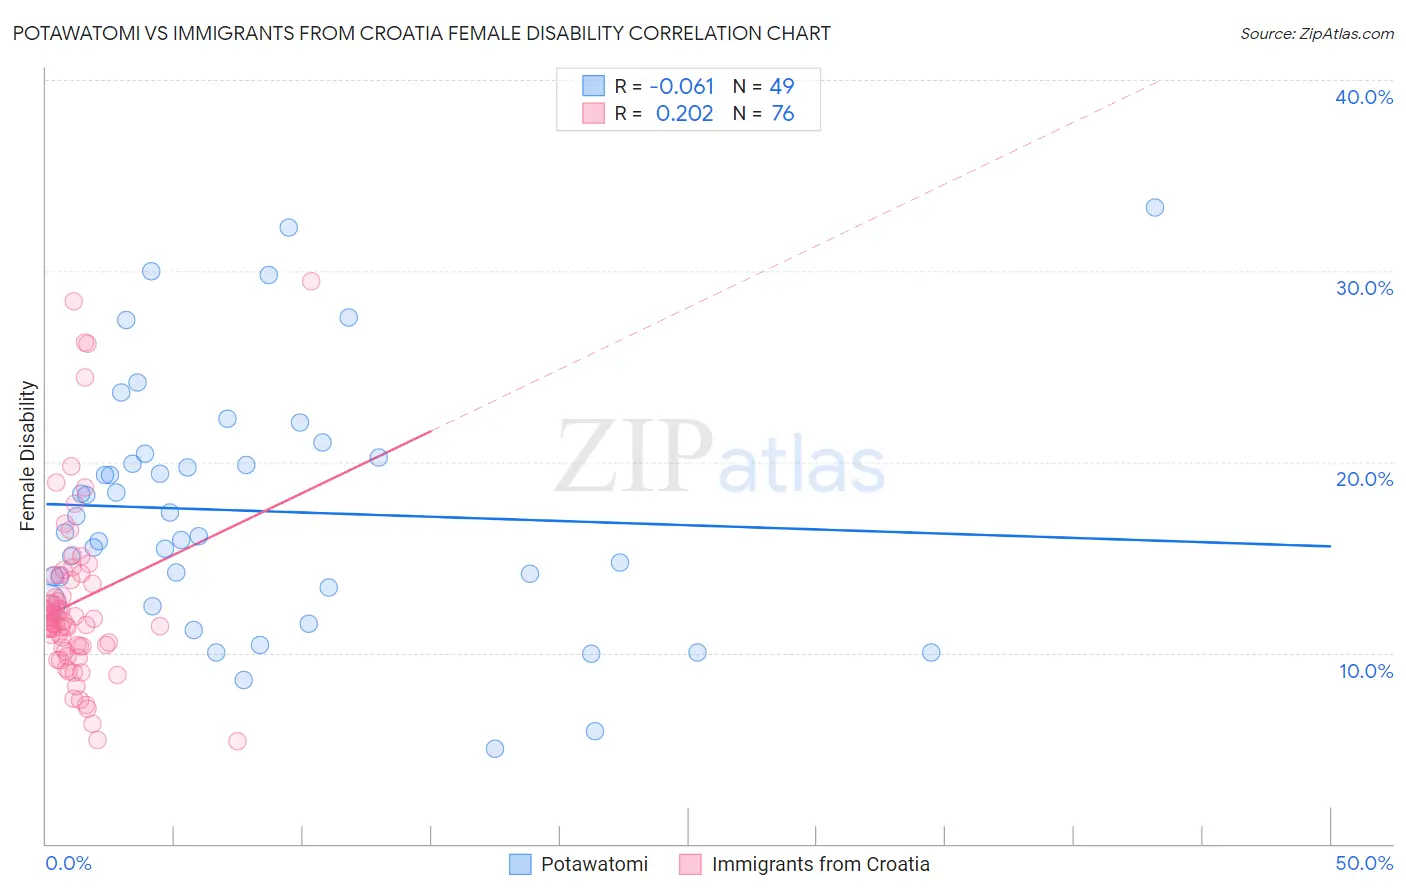
Potawatomi vs Immigrants from Croatia Female Disability Correlation Chart
The statistical analysis conducted on geographies consisting of 117,767,381 people shows a slight negative correlation between the proportion of Potawatomi and percentage of females with a disability in the United States with a correlation coefficient (R) of -0.061 and weighted average of 14.1%. Similarly, the statistical analysis conducted on geographies consisting of 132,577,036 people shows a weak positive correlation between the proportion of Immigrants from Croatia and percentage of females with a disability in the United States with a correlation coefficient (R) of 0.202 and weighted average of 11.8%, a difference of 19.5%.
Female Disability Correlation Summary
| Measurement | Potawatomi | Immigrants from Croatia |
| Minimum | 5.0% | 5.3% |
| Maximum | 33.3% | 29.4% |
| Range | 28.3% | 24.1% |
| Mean | 17.4% | 12.7% |
| Median | 16.3% | 11.6% |
| Interquartile 25% (IQ1) | 13.0% | 10.3% |
| Interquartile 75% (IQ3) | 20.3% | 13.9% |
| Interquartile Range (IQR) | 7.3% | 3.6% |
| Standard Deviation (Sample) | 6.5% | 4.8% |
| Standard Deviation (Population) | 6.4% | 4.7% |
Similar Demographics by Female Disability
Demographics Similar to Potawatomi by Female Disability
In terms of female disability, the demographic groups most similar to Potawatomi are Pueblo (14.1%, a difference of 0.010%), American (14.1%, a difference of 0.14%), Black/African American (14.1%, a difference of 0.18%), Native/Alaskan (14.1%, a difference of 0.20%), and Navajo (14.2%, a difference of 0.33%).
| Demographics | Rating | Rank | Female Disability |
| Puget Sound Salish | 0.0 /100 | #314 | Tragic 13.8% |
| Alaskan Athabascans | 0.0 /100 | #315 | Tragic 13.9% |
| Spanish Americans | 0.0 /100 | #316 | Tragic 14.0% |
| Chippewa | 0.0 /100 | #317 | Tragic 14.0% |
| Paiute | 0.0 /100 | #318 | Tragic 14.0% |
| Iroquois | 0.0 /100 | #319 | Tragic 14.0% |
| Americans | 0.0 /100 | #320 | Tragic 14.1% |
| Potawatomi | 0.0 /100 | #321 | Tragic 14.1% |
| Pueblo | 0.0 /100 | #322 | Tragic 14.1% |
| Blacks/African Americans | 0.0 /100 | #323 | Tragic 14.1% |
| Natives/Alaskans | 0.0 /100 | #324 | Tragic 14.1% |
| Navajo | 0.0 /100 | #325 | Tragic 14.2% |
| Comanche | 0.0 /100 | #326 | Tragic 14.2% |
| Ottawa | 0.0 /100 | #327 | Tragic 14.2% |
| Cape Verdeans | 0.0 /100 | #328 | Tragic 14.2% |
Demographics Similar to Immigrants from Croatia by Female Disability
In terms of female disability, the demographic groups most similar to Immigrants from Croatia are Immigrants from North Macedonia (11.8%, a difference of 0.050%), Russian (11.8%, a difference of 0.050%), Immigrants from Netherlands (11.8%, a difference of 0.060%), Immigrants from Italy (11.8%, a difference of 0.070%), and Immigrants from Kazakhstan (11.8%, a difference of 0.090%).
| Demographics | Rating | Rank | Female Disability |
| Immigrants | Morocco | 97.6 /100 | #116 | Exceptional 11.8% |
| Immigrants | Eastern Europe | 97.2 /100 | #117 | Exceptional 11.8% |
| Immigrants | Nigeria | 97.2 /100 | #118 | Exceptional 11.8% |
| Immigrants | Uganda | 97.2 /100 | #119 | Exceptional 11.8% |
| Immigrants | Kazakhstan | 97.0 /100 | #120 | Exceptional 11.8% |
| Immigrants | Netherlands | 96.9 /100 | #121 | Exceptional 11.8% |
| Immigrants | North Macedonia | 96.8 /100 | #122 | Exceptional 11.8% |
| Immigrants | Croatia | 96.7 /100 | #123 | Exceptional 11.8% |
| Russians | 96.5 /100 | #124 | Exceptional 11.8% |
| Immigrants | Italy | 96.4 /100 | #125 | Exceptional 11.8% |
| Immigrants | Europe | 96.2 /100 | #126 | Exceptional 11.8% |
| South American Indians | 95.8 /100 | #127 | Exceptional 11.8% |
| Immigrants | Latvia | 95.6 /100 | #128 | Exceptional 11.8% |
| Macedonians | 95.5 /100 | #129 | Exceptional 11.8% |
| Nicaraguans | 95.2 /100 | #130 | Exceptional 11.9% |