Lithuanian vs Immigrants from Croatia 1 or more Vehicles in Household
COMPARE
Lithuanian
Immigrants from Croatia
1 or more Vehicles in Household
1 or more Vehicles in Household Comparison
Lithuanians
Immigrants from Croatia
91.7%
1 OR MORE VEHICLES IN HOUSEHOLD
99.7/ 100
METRIC RATING
70th/ 347
METRIC RANK
87.0%
1 OR MORE VEHICLES IN HOUSEHOLD
0.0/ 100
METRIC RATING
280th/ 347
METRIC RANK
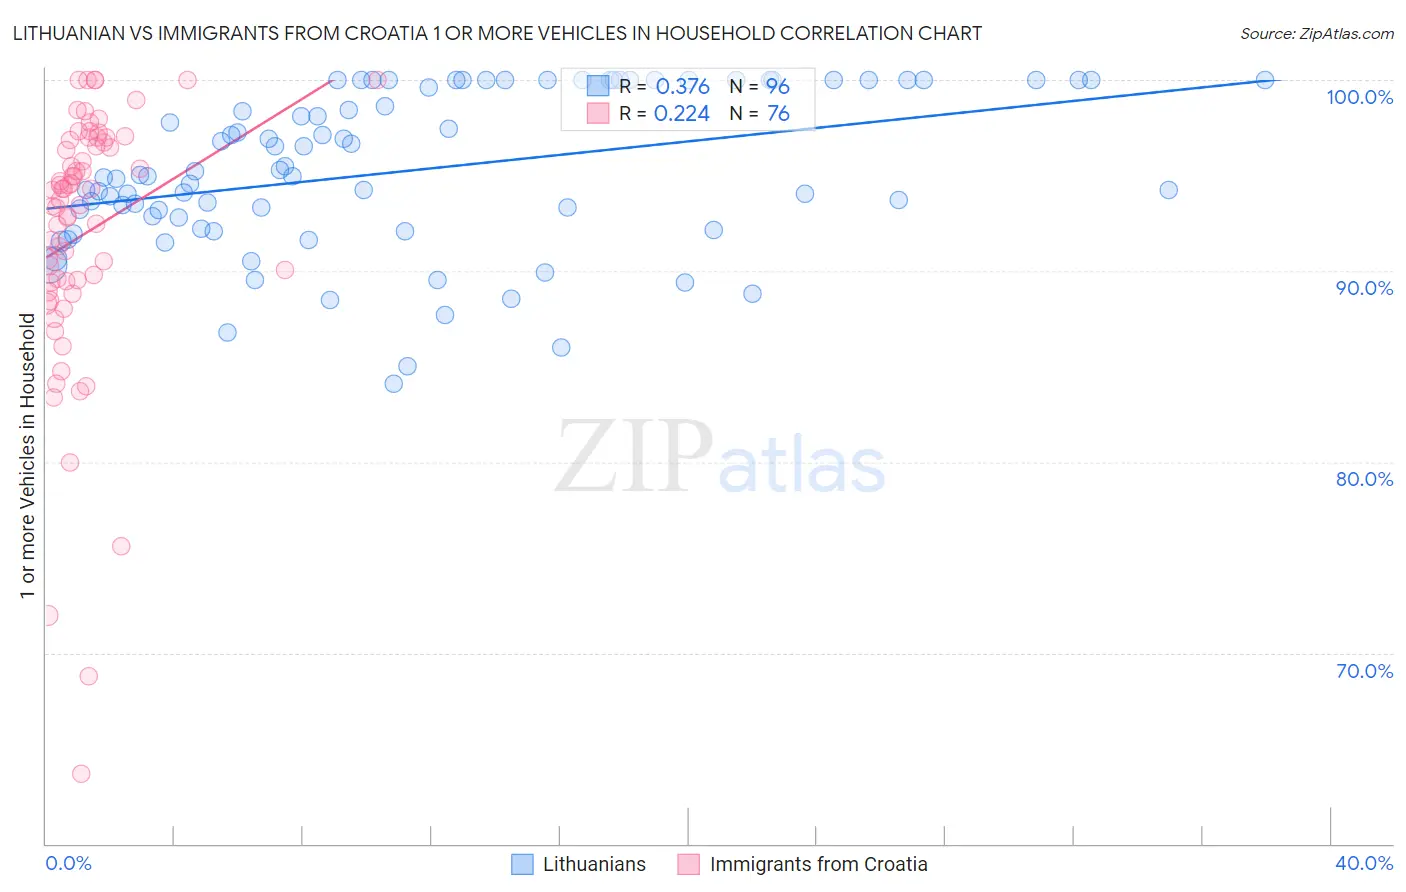
Lithuanian vs Immigrants from Croatia 1 or more Vehicles in Household Correlation Chart
The statistical analysis conducted on geographies consisting of 421,786,963 people shows a mild positive correlation between the proportion of Lithuanians and percentage of households with 1 or more vehicles available in the United States with a correlation coefficient (R) of 0.376 and weighted average of 91.7%. Similarly, the statistical analysis conducted on geographies consisting of 132,537,913 people shows a weak positive correlation between the proportion of Immigrants from Croatia and percentage of households with 1 or more vehicles available in the United States with a correlation coefficient (R) of 0.224 and weighted average of 87.0%, a difference of 5.4%.
1 or more Vehicles in Household Correlation Summary
| Measurement | Lithuanian | Immigrants from Croatia |
| Minimum | 84.1% | 63.6% |
| Maximum | 100.0% | 100.0% |
| Range | 15.9% | 36.4% |
| Mean | 95.3% | 91.9% |
| Median | 95.0% | 94.0% |
| Interquartile 25% (IQ1) | 92.5% | 89.4% |
| Interquartile 75% (IQ3) | 100.0% | 96.8% |
| Interquartile Range (IQR) | 7.5% | 7.4% |
| Standard Deviation (Sample) | 4.2% | 7.0% |
| Standard Deviation (Population) | 4.1% | 7.0% |
Similar Demographics by 1 or more Vehicles in Household
Demographics Similar to Lithuanians by 1 or more Vehicles in Household
In terms of 1 or more vehicles in household, the demographic groups most similar to Lithuanians are Palestinian (91.7%, a difference of 0.020%), Polish (91.7%, a difference of 0.020%), Cajun (91.7%, a difference of 0.020%), Immigrants from Iran (91.7%, a difference of 0.030%), and Immigrants from Scotland (91.8%, a difference of 0.060%).
| Demographics | Rating | Rank | 1 or more Vehicles in Household |
| Chinese | 99.8 /100 | #63 | Exceptional 91.9% |
| Croatians | 99.8 /100 | #64 | Exceptional 91.9% |
| Immigrants | Laos | 99.8 /100 | #65 | Exceptional 91.8% |
| Canadians | 99.8 /100 | #66 | Exceptional 91.8% |
| Spaniards | 99.8 /100 | #67 | Exceptional 91.8% |
| Immigrants | Scotland | 99.7 /100 | #68 | Exceptional 91.8% |
| Palestinians | 99.7 /100 | #69 | Exceptional 91.7% |
| Lithuanians | 99.7 /100 | #70 | Exceptional 91.7% |
| Poles | 99.7 /100 | #71 | Exceptional 91.7% |
| Cajuns | 99.7 /100 | #72 | Exceptional 91.7% |
| Immigrants | Iran | 99.7 /100 | #73 | Exceptional 91.7% |
| Immigrants | Lebanon | 99.6 /100 | #74 | Exceptional 91.6% |
| Portuguese | 99.5 /100 | #75 | Exceptional 91.6% |
| Cubans | 99.5 /100 | #76 | Exceptional 91.5% |
| Immigrants | Philippines | 99.4 /100 | #77 | Exceptional 91.5% |
Demographics Similar to Immigrants from Croatia by 1 or more Vehicles in Household
In terms of 1 or more vehicles in household, the demographic groups most similar to Immigrants from Croatia are Immigrants from Southern Europe (87.1%, a difference of 0.030%), Immigrants from Albania (87.1%, a difference of 0.030%), Mongolian (87.0%, a difference of 0.060%), Alsatian (87.1%, a difference of 0.070%), and Immigrants from France (87.1%, a difference of 0.13%).
| Demographics | Rating | Rank | 1 or more Vehicles in Household |
| Immigrants | Northern Africa | 0.2 /100 | #273 | Tragic 87.4% |
| Immigrants | Morocco | 0.1 /100 | #274 | Tragic 87.4% |
| Immigrants | Singapore | 0.1 /100 | #275 | Tragic 87.2% |
| Immigrants | France | 0.1 /100 | #276 | Tragic 87.1% |
| Alsatians | 0.1 /100 | #277 | Tragic 87.1% |
| Immigrants | Southern Europe | 0.1 /100 | #278 | Tragic 87.1% |
| Immigrants | Albania | 0.1 /100 | #279 | Tragic 87.1% |
| Immigrants | Croatia | 0.0 /100 | #280 | Tragic 87.0% |
| Mongolians | 0.0 /100 | #281 | Tragic 87.0% |
| Colville | 0.0 /100 | #282 | Tragic 86.8% |
| Immigrants | Eastern Europe | 0.0 /100 | #283 | Tragic 86.7% |
| Central American Indians | 0.0 /100 | #284 | Tragic 86.7% |
| Immigrants | Kazakhstan | 0.0 /100 | #285 | Tragic 86.6% |
| Immigrants | Eastern Asia | 0.0 /100 | #286 | Tragic 86.5% |
| Immigrants | Malaysia | 0.0 /100 | #287 | Tragic 86.5% |