Liberian vs Soviet Union Median Female Earnings
COMPARE
Liberian
Soviet Union
Median Female Earnings
Median Female Earnings Comparison
Liberians
Soviet Union
$38,215
MEDIAN FEMALE EARNINGS
4.4/ 100
METRIC RATING
236th/ 347
METRIC RANK
$46,556
MEDIAN FEMALE EARNINGS
100.0/ 100
METRIC RATING
14th/ 347
METRIC RANK
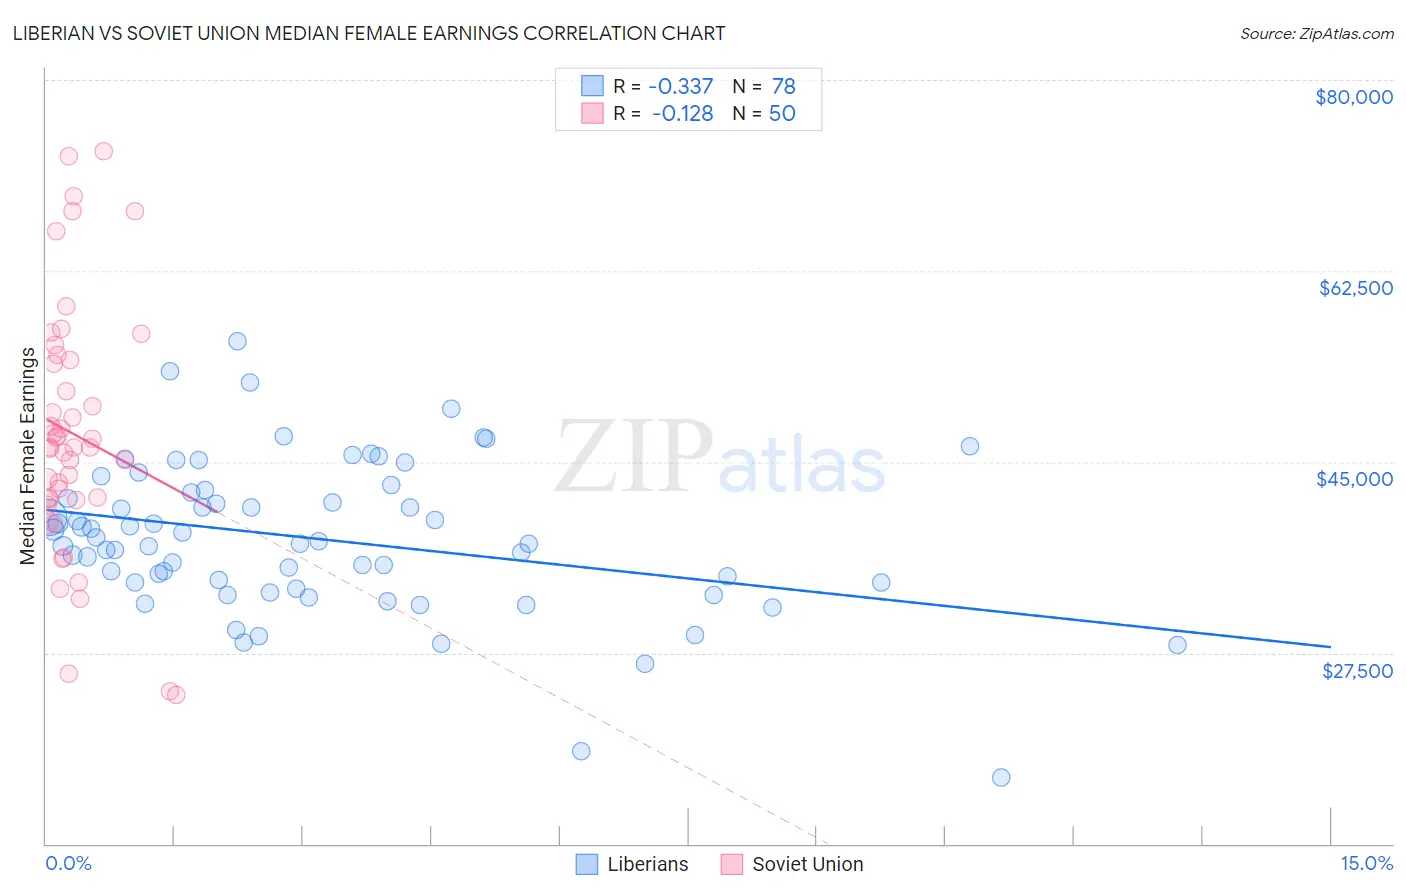
Liberian vs Soviet Union Median Female Earnings Correlation Chart
The statistical analysis conducted on geographies consisting of 118,095,616 people shows a mild negative correlation between the proportion of Liberians and median female earnings in the United States with a correlation coefficient (R) of -0.337 and weighted average of $38,215. Similarly, the statistical analysis conducted on geographies consisting of 43,506,452 people shows a poor negative correlation between the proportion of Soviet Union and median female earnings in the United States with a correlation coefficient (R) of -0.128 and weighted average of $46,556, a difference of 21.8%.
Median Female Earnings Correlation Summary
| Measurement | Liberian | Soviet Union |
| Minimum | $16,076 | $23,611 |
| Maximum | $56,012 | $73,520 |
| Range | $39,936 | $49,909 |
| Mean | $37,973 | $47,577 |
| Median | $37,624 | $46,321 |
| Interquartile 25% (IQ1) | $33,939 | $41,646 |
| Interquartile 75% (IQ3) | $42,173 | $54,381 |
| Interquartile Range (IQR) | $8,234 | $12,735 |
| Standard Deviation (Sample) | $6,991 | $11,528 |
| Standard Deviation (Population) | $6,946 | $11,412 |
Similar Demographics by Median Female Earnings
Demographics Similar to Liberians by Median Female Earnings
In terms of median female earnings, the demographic groups most similar to Liberians are Sudanese ($38,215, a difference of 0.0%), Immigrants from Cabo Verde ($38,208, a difference of 0.020%), Alaska Native ($38,202, a difference of 0.030%), English ($38,196, a difference of 0.050%), and Finnish ($38,173, a difference of 0.11%).
| Demographics | Rating | Rank | Median Female Earnings |
| Belgians | 6.1 /100 | #229 | Tragic $38,382 |
| Basques | 5.7 /100 | #230 | Tragic $38,352 |
| Somalis | 5.5 /100 | #231 | Tragic $38,333 |
| Scandinavians | 5.2 /100 | #232 | Tragic $38,306 |
| Tongans | 5.1 /100 | #233 | Tragic $38,288 |
| Celtics | 5.0 /100 | #234 | Tragic $38,283 |
| Sudanese | 4.4 /100 | #235 | Tragic $38,215 |
| Liberians | 4.4 /100 | #236 | Tragic $38,215 |
| Immigrants | Cabo Verde | 4.3 /100 | #237 | Tragic $38,208 |
| Alaska Natives | 4.3 /100 | #238 | Tragic $38,202 |
| English | 4.2 /100 | #239 | Tragic $38,196 |
| Finns | 4.0 /100 | #240 | Tragic $38,173 |
| Spanish | 3.5 /100 | #241 | Tragic $38,098 |
| Immigrants | Burma/Myanmar | 3.0 /100 | #242 | Tragic $38,028 |
| Germans | 2.8 /100 | #243 | Tragic $37,986 |
Demographics Similar to Soviet Union by Median Female Earnings
In terms of median female earnings, the demographic groups most similar to Soviet Union are Immigrants from Australia ($46,573, a difference of 0.040%), Immigrants from Eastern Asia ($46,502, a difference of 0.11%), Indian (Asian) ($46,481, a difference of 0.16%), Immigrants from South Central Asia ($46,324, a difference of 0.50%), and Immigrants from Israel ($46,902, a difference of 0.74%).
| Demographics | Rating | Rank | Median Female Earnings |
| Thais | 100.0 /100 | #7 | Exceptional $47,577 |
| Iranians | 100.0 /100 | #8 | Exceptional $47,421 |
| Immigrants | Iran | 100.0 /100 | #9 | Exceptional $47,154 |
| Immigrants | China | 100.0 /100 | #10 | Exceptional $46,972 |
| Okinawans | 100.0 /100 | #11 | Exceptional $46,905 |
| Immigrants | Israel | 100.0 /100 | #12 | Exceptional $46,902 |
| Immigrants | Australia | 100.0 /100 | #13 | Exceptional $46,573 |
| Soviet Union | 100.0 /100 | #14 | Exceptional $46,556 |
| Immigrants | Eastern Asia | 100.0 /100 | #15 | Exceptional $46,502 |
| Indians (Asian) | 100.0 /100 | #16 | Exceptional $46,481 |
| Immigrants | South Central Asia | 100.0 /100 | #17 | Exceptional $46,324 |
| Cypriots | 100.0 /100 | #18 | Exceptional $45,570 |
| Eastern Europeans | 100.0 /100 | #19 | Exceptional $45,385 |
| Immigrants | Japan | 100.0 /100 | #20 | Exceptional $45,323 |
| Cambodians | 100.0 /100 | #21 | Exceptional $45,014 |