Liberian vs Immigrants from Taiwan Self-Care Disability
COMPARE
Liberian
Immigrants from Taiwan
Self-Care Disability
Self-Care Disability Comparison
Liberians
Immigrants from Taiwan
2.6%
SELF-CARE DISABILITY
2.1/ 100
METRIC RATING
233rd/ 347
METRIC RANK
2.2%
SELF-CARE DISABILITY
100.0/ 100
METRIC RATING
18th/ 347
METRIC RANK
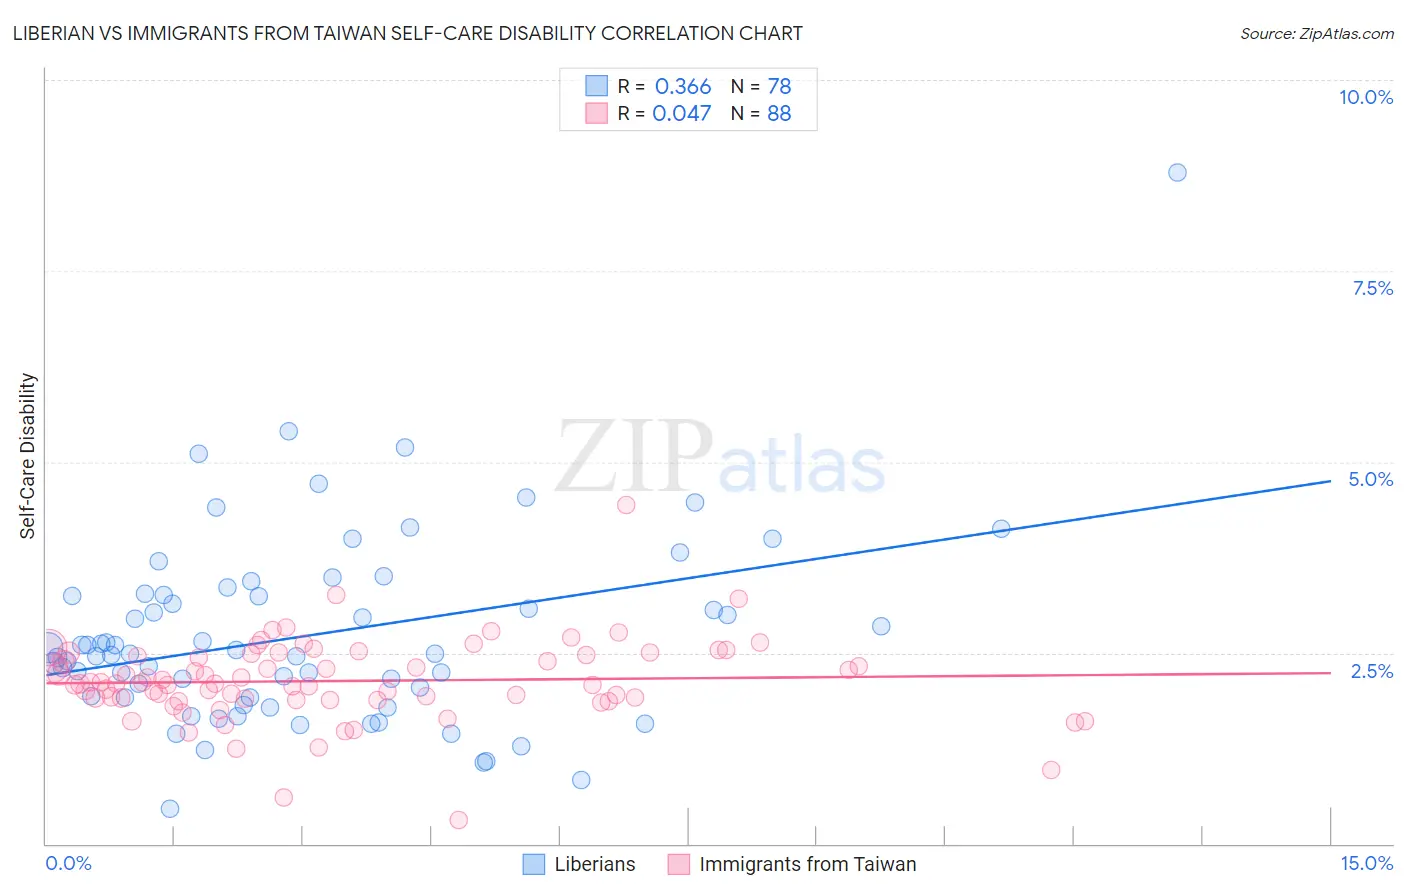
Liberian vs Immigrants from Taiwan Self-Care Disability Correlation Chart
The statistical analysis conducted on geographies consisting of 117,995,885 people shows a mild positive correlation between the proportion of Liberians and percentage of population with self-care disability in the United States with a correlation coefficient (R) of 0.366 and weighted average of 2.6%. Similarly, the statistical analysis conducted on geographies consisting of 297,966,372 people shows no correlation between the proportion of Immigrants from Taiwan and percentage of population with self-care disability in the United States with a correlation coefficient (R) of 0.047 and weighted average of 2.2%, a difference of 16.5%.
Self-Care Disability Correlation Summary
| Measurement | Liberian | Immigrants from Taiwan |
| Minimum | 0.46% | 0.31% |
| Maximum | 8.8% | 4.4% |
| Range | 8.3% | 4.1% |
| Mean | 2.7% | 2.1% |
| Median | 2.5% | 2.1% |
| Interquartile 25% (IQ1) | 1.9% | 1.9% |
| Interquartile 75% (IQ3) | 3.2% | 2.5% |
| Interquartile Range (IQR) | 1.3% | 0.58% |
| Standard Deviation (Sample) | 1.3% | 0.54% |
| Standard Deviation (Population) | 1.2% | 0.54% |
Similar Demographics by Self-Care Disability
Demographics Similar to Liberians by Self-Care Disability
In terms of self-care disability, the demographic groups most similar to Liberians are Vietnamese (2.6%, a difference of 0.010%), Albanian (2.6%, a difference of 0.040%), Bahamian (2.6%, a difference of 0.040%), Immigrants from Guatemala (2.6%, a difference of 0.070%), and Bermudan (2.6%, a difference of 0.11%).
| Demographics | Rating | Rank | Self-Care Disability |
| Chinese | 2.9 /100 | #226 | Tragic 2.6% |
| Immigrants | Philippines | 2.7 /100 | #227 | Tragic 2.6% |
| Guatemalans | 2.7 /100 | #228 | Tragic 2.6% |
| Guamanians/Chamorros | 2.5 /100 | #229 | Tragic 2.6% |
| Immigrants | Ecuador | 2.5 /100 | #230 | Tragic 2.6% |
| Immigrants | Guatemala | 2.2 /100 | #231 | Tragic 2.6% |
| Albanians | 2.2 /100 | #232 | Tragic 2.6% |
| Liberians | 2.1 /100 | #233 | Tragic 2.6% |
| Vietnamese | 2.1 /100 | #234 | Tragic 2.6% |
| Bahamians | 2.0 /100 | #235 | Tragic 2.6% |
| Bermudans | 1.9 /100 | #236 | Tragic 2.6% |
| Immigrants | Senegal | 1.6 /100 | #237 | Tragic 2.6% |
| Senegalese | 1.3 /100 | #238 | Tragic 2.6% |
| Immigrants | Panama | 1.2 /100 | #239 | Tragic 2.6% |
| Marshallese | 1.2 /100 | #240 | Tragic 2.6% |
Demographics Similar to Immigrants from Taiwan by Self-Care Disability
In terms of self-care disability, the demographic groups most similar to Immigrants from Taiwan are Immigrants from Saudi Arabia (2.2%, a difference of 0.25%), Immigrants from Eritrea (2.2%, a difference of 0.33%), Tongan (2.2%, a difference of 0.41%), Immigrants from Kuwait (2.2%, a difference of 0.42%), and Bulgarian (2.2%, a difference of 0.66%).
| Demographics | Rating | Rank | Self-Care Disability |
| Immigrants | South Central Asia | 100.0 /100 | #11 | Exceptional 2.2% |
| Immigrants | Ethiopia | 100.0 /100 | #12 | Exceptional 2.2% |
| Ethiopians | 100.0 /100 | #13 | Exceptional 2.2% |
| Luxembourgers | 100.0 /100 | #14 | Exceptional 2.2% |
| Okinawans | 100.0 /100 | #15 | Exceptional 2.2% |
| Immigrants | Kuwait | 100.0 /100 | #16 | Exceptional 2.2% |
| Immigrants | Saudi Arabia | 100.0 /100 | #17 | Exceptional 2.2% |
| Immigrants | Taiwan | 100.0 /100 | #18 | Exceptional 2.2% |
| Immigrants | Eritrea | 100.0 /100 | #19 | Exceptional 2.2% |
| Tongans | 100.0 /100 | #20 | Exceptional 2.2% |
| Bulgarians | 100.0 /100 | #21 | Exceptional 2.2% |
| Immigrants | Venezuela | 100.0 /100 | #22 | Exceptional 2.2% |
| Cambodians | 100.0 /100 | #23 | Exceptional 2.2% |
| Cypriots | 100.0 /100 | #24 | Exceptional 2.2% |
| Turks | 100.0 /100 | #25 | Exceptional 2.2% |