Liberian vs Immigrants from Nicaragua Unemployment Among Ages 16 to 19 years
COMPARE
Liberian
Immigrants from Nicaragua
Unemployment Among Ages 16 to 19 years
Unemployment Among Ages 16 to 19 years Comparison
Liberians
Immigrants from Nicaragua
17.9%
UNEMPLOYMENT AMONG AGES 16 TO 19 YEARS
18.6/ 100
METRIC RATING
207th/ 347
METRIC RANK
17.6%
UNEMPLOYMENT AMONG AGES 16 TO 19 YEARS
42.2/ 100
METRIC RATING
188th/ 347
METRIC RANK
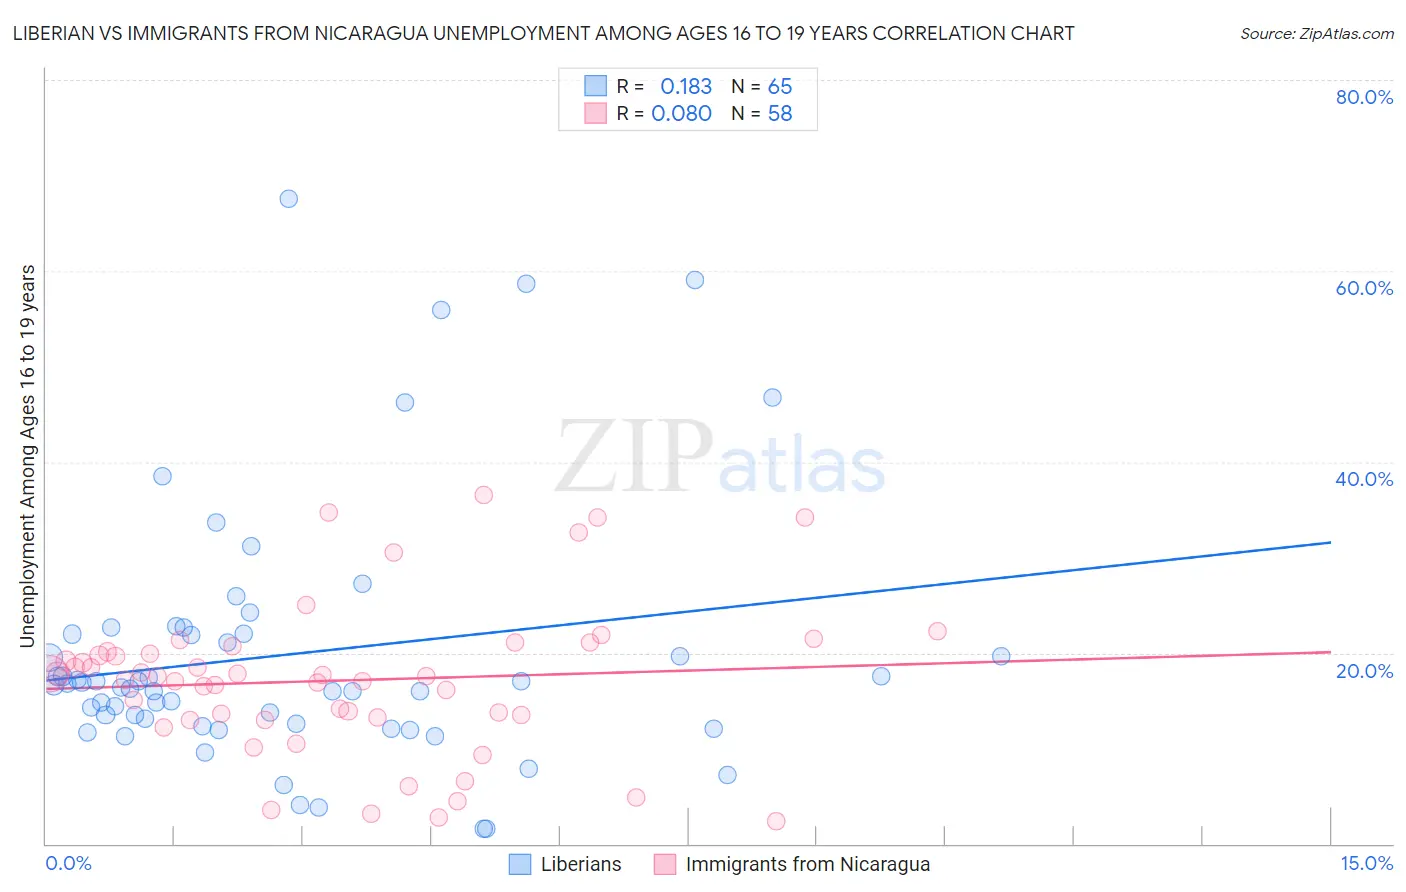
Liberian vs Immigrants from Nicaragua Unemployment Among Ages 16 to 19 years Correlation Chart
The statistical analysis conducted on geographies consisting of 116,388,643 people shows a poor positive correlation between the proportion of Liberians and unemployment rate among population between the ages 16 and 19 in the United States with a correlation coefficient (R) of 0.183 and weighted average of 17.9%. Similarly, the statistical analysis conducted on geographies consisting of 229,845,373 people shows a slight positive correlation between the proportion of Immigrants from Nicaragua and unemployment rate among population between the ages 16 and 19 in the United States with a correlation coefficient (R) of 0.080 and weighted average of 17.6%, a difference of 1.4%.
Unemployment Among Ages 16 to 19 years Correlation Summary
| Measurement | Liberian | Immigrants from Nicaragua |
| Minimum | 1.6% | 2.4% |
| Maximum | 67.6% | 36.6% |
| Range | 66.0% | 34.2% |
| Mean | 19.8% | 17.1% |
| Median | 16.7% | 17.6% |
| Interquartile 25% (IQ1) | 12.4% | 13.2% |
| Interquartile 75% (IQ3) | 22.0% | 20.1% |
| Interquartile Range (IQR) | 9.6% | 6.9% |
| Standard Deviation (Sample) | 13.5% | 7.9% |
| Standard Deviation (Population) | 13.4% | 7.8% |
Demographics Similar to Liberians and Immigrants from Nicaragua by Unemployment Among Ages 16 to 19 years
In terms of unemployment among ages 16 to 19 years, the demographic groups most similar to Liberians are Immigrants from Southern Europe (17.9%, a difference of 0.020%), Nonimmigrants (17.9%, a difference of 0.16%), Assyrian/Chaldean/Syriac (17.9%, a difference of 0.16%), Immigrants from Eastern Europe (17.8%, a difference of 0.35%), and Immigrants from Portugal (17.8%, a difference of 0.57%). Similarly, the demographic groups most similar to Immigrants from Nicaragua are Immigrants from Micronesia (17.6%, a difference of 0.010%), Immigrants from Europe (17.6%, a difference of 0.020%), Marshallese (17.6%, a difference of 0.020%), Immigrants from Costa Rica (17.6%, a difference of 0.040%), and Immigrants from Philippines (17.7%, a difference of 0.070%).
| Demographics | Rating | Rank | Unemployment Among Ages 16 to 19 years |
| Immigrants | Micronesia | 42.4 /100 | #187 | Average 17.6% |
| Immigrants | Nicaragua | 42.2 /100 | #188 | Average 17.6% |
| Immigrants | Europe | 41.8 /100 | #189 | Average 17.6% |
| Marshallese | 41.7 /100 | #190 | Average 17.6% |
| Immigrants | Costa Rica | 41.3 /100 | #191 | Average 17.6% |
| Immigrants | Philippines | 40.7 /100 | #192 | Average 17.7% |
| Immigrants | Australia | 40.6 /100 | #193 | Average 17.7% |
| Peruvians | 38.8 /100 | #194 | Fair 17.7% |
| Immigrants | Peru | 37.3 /100 | #195 | Fair 17.7% |
| Alaskan Athabascans | 34.1 /100 | #196 | Fair 17.7% |
| Immigrants | Czechoslovakia | 29.8 /100 | #197 | Fair 17.8% |
| Ethiopians | 29.6 /100 | #198 | Fair 17.8% |
| Immigrants | Ireland | 28.5 /100 | #199 | Fair 17.8% |
| Immigrants | Fiji | 27.7 /100 | #200 | Fair 17.8% |
| Immigrants | Ethiopia | 27.4 /100 | #201 | Fair 17.8% |
| Immigrants | Portugal | 27.2 /100 | #202 | Fair 17.8% |
| Immigrants | Eastern Europe | 23.6 /100 | #203 | Fair 17.8% |
| Immigrants | Nonimmigrants | 20.9 /100 | #204 | Fair 17.9% |
| Assyrians/Chaldeans/Syriacs | 20.8 /100 | #205 | Fair 17.9% |
| Immigrants | Southern Europe | 18.9 /100 | #206 | Poor 17.9% |
| Liberians | 18.6 /100 | #207 | Poor 17.9% |