Liberian vs Immigrants from Greece Currently Married
COMPARE
Liberian
Immigrants from Greece
Currently Married
Currently Married Comparison
Liberians
Immigrants from Greece
42.2%
CURRENTLY MARRIED
0.0/ 100
METRIC RATING
299th/ 347
METRIC RANK
47.7%
CURRENTLY MARRIED
93.1/ 100
METRIC RATING
106th/ 347
METRIC RANK
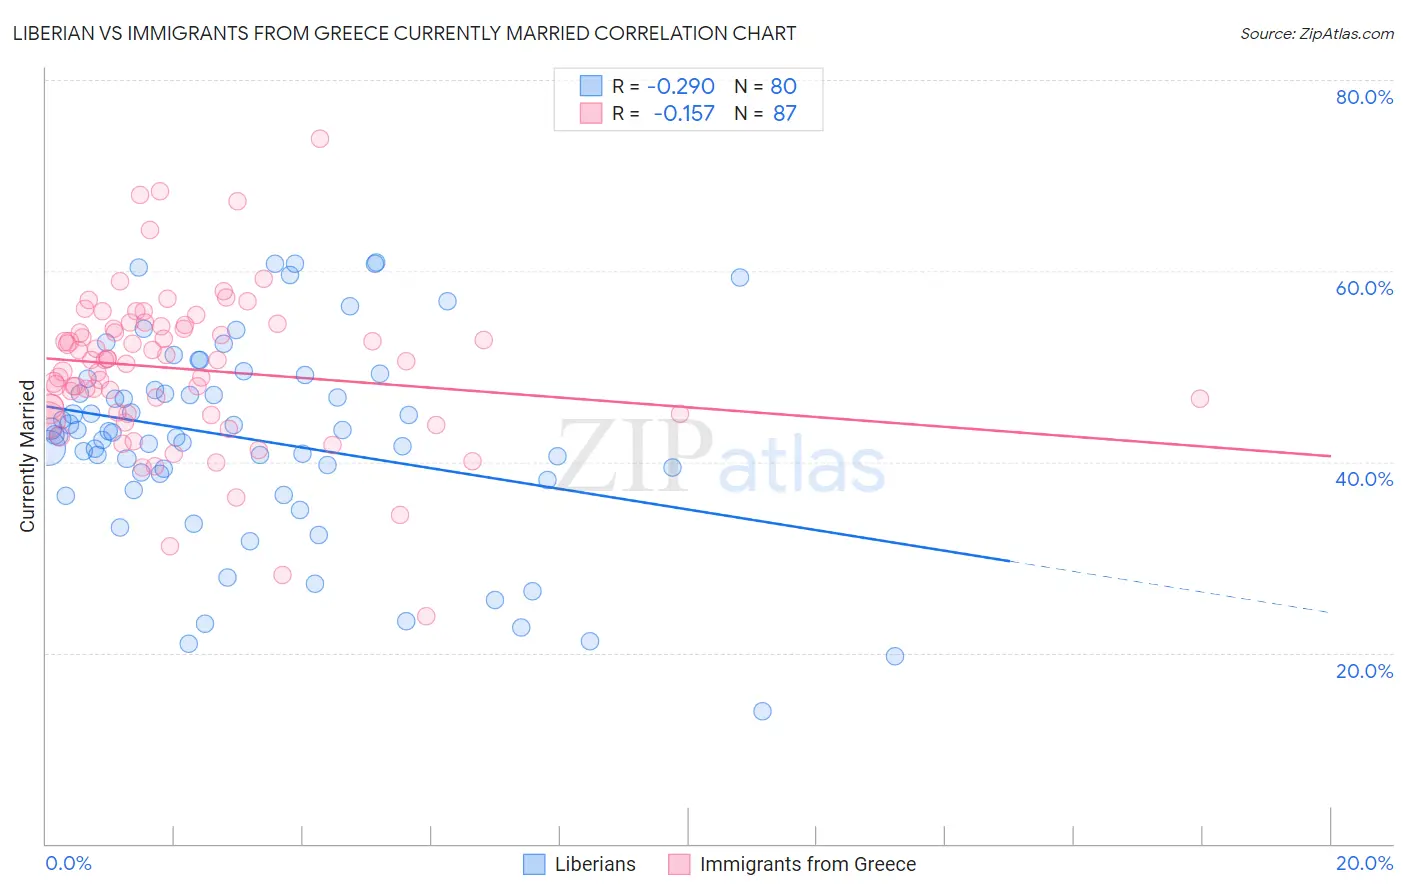
Liberian vs Immigrants from Greece Currently Married Correlation Chart
The statistical analysis conducted on geographies consisting of 118,089,521 people shows a weak negative correlation between the proportion of Liberians and percentage of population currently married in the United States with a correlation coefficient (R) of -0.290 and weighted average of 42.2%. Similarly, the statistical analysis conducted on geographies consisting of 216,874,138 people shows a poor negative correlation between the proportion of Immigrants from Greece and percentage of population currently married in the United States with a correlation coefficient (R) of -0.157 and weighted average of 47.7%, a difference of 13.1%.
Currently Married Correlation Summary
| Measurement | Liberian | Immigrants from Greece |
| Minimum | 13.9% | 23.8% |
| Maximum | 60.9% | 73.8% |
| Range | 47.0% | 50.0% |
| Mean | 42.3% | 49.7% |
| Median | 42.9% | 50.6% |
| Interquartile 25% (IQ1) | 38.4% | 45.0% |
| Interquartile 75% (IQ3) | 48.1% | 54.2% |
| Interquartile Range (IQR) | 9.7% | 9.1% |
| Standard Deviation (Sample) | 10.5% | 8.1% |
| Standard Deviation (Population) | 10.4% | 8.1% |
Similar Demographics by Currently Married
Demographics Similar to Liberians by Currently Married
In terms of currently married, the demographic groups most similar to Liberians are Immigrants from Honduras (42.2%, a difference of 0.030%), Belizean (42.2%, a difference of 0.10%), Cheyenne (42.2%, a difference of 0.12%), Menominee (42.3%, a difference of 0.23%), and Immigrants from Yemen (42.1%, a difference of 0.34%).
| Demographics | Rating | Rank | Currently Married |
| Sub-Saharan Africans | 0.0 /100 | #292 | Tragic 42.6% |
| Yuman | 0.0 /100 | #293 | Tragic 42.6% |
| Hondurans | 0.0 /100 | #294 | Tragic 42.5% |
| Immigrants | Western Africa | 0.0 /100 | #295 | Tragic 42.4% |
| Menominee | 0.0 /100 | #296 | Tragic 42.3% |
| Cheyenne | 0.0 /100 | #297 | Tragic 42.2% |
| Immigrants | Honduras | 0.0 /100 | #298 | Tragic 42.2% |
| Liberians | 0.0 /100 | #299 | Tragic 42.2% |
| Belizeans | 0.0 /100 | #300 | Tragic 42.2% |
| Immigrants | Yemen | 0.0 /100 | #301 | Tragic 42.1% |
| Immigrants | Zaire | 0.0 /100 | #302 | Tragic 42.0% |
| Sioux | 0.0 /100 | #303 | Tragic 41.9% |
| Immigrants | Bahamas | 0.0 /100 | #304 | Tragic 41.9% |
| Immigrants | Trinidad and Tobago | 0.0 /100 | #305 | Tragic 41.9% |
| Immigrants | Guyana | 0.0 /100 | #306 | Tragic 41.9% |
Demographics Similar to Immigrants from Greece by Currently Married
In terms of currently married, the demographic groups most similar to Immigrants from Greece are Immigrants from Singapore (47.8%, a difference of 0.030%), Immigrants from Italy (47.7%, a difference of 0.030%), Serbian (47.8%, a difference of 0.080%), Cypriot (47.8%, a difference of 0.090%), and Tsimshian (47.7%, a difference of 0.090%).
| Demographics | Rating | Rank | Currently Married |
| Immigrants | Sweden | 94.3 /100 | #99 | Exceptional 47.8% |
| Celtics | 94.2 /100 | #100 | Exceptional 47.8% |
| Immigrants | Germany | 94.1 /100 | #101 | Exceptional 47.8% |
| Turks | 93.9 /100 | #102 | Exceptional 47.8% |
| Cypriots | 93.7 /100 | #103 | Exceptional 47.8% |
| Serbians | 93.6 /100 | #104 | Exceptional 47.8% |
| Immigrants | Singapore | 93.3 /100 | #105 | Exceptional 47.8% |
| Immigrants | Greece | 93.1 /100 | #106 | Exceptional 47.7% |
| Immigrants | Italy | 92.9 /100 | #107 | Exceptional 47.7% |
| Tsimshian | 92.4 /100 | #108 | Exceptional 47.7% |
| Immigrants | Egypt | 92.3 /100 | #109 | Exceptional 47.7% |
| Immigrants | Russia | 92.0 /100 | #110 | Exceptional 47.7% |
| Immigrants | Hungary | 91.2 /100 | #111 | Exceptional 47.6% |
| Immigrants | Western Europe | 91.1 /100 | #112 | Exceptional 47.6% |
| Immigrants | Denmark | 90.9 /100 | #113 | Exceptional 47.6% |