Liberian vs Immigrants from Greece Bachelor's Degree
COMPARE
Liberian
Immigrants from Greece
Bachelor's Degree
Bachelor's Degree Comparison
Liberians
Immigrants from Greece
34.6%
BACHELOR'S DEGREE
2.8/ 100
METRIC RATING
236th/ 347
METRIC RANK
44.5%
BACHELOR'S DEGREE
99.9/ 100
METRIC RATING
50th/ 347
METRIC RANK
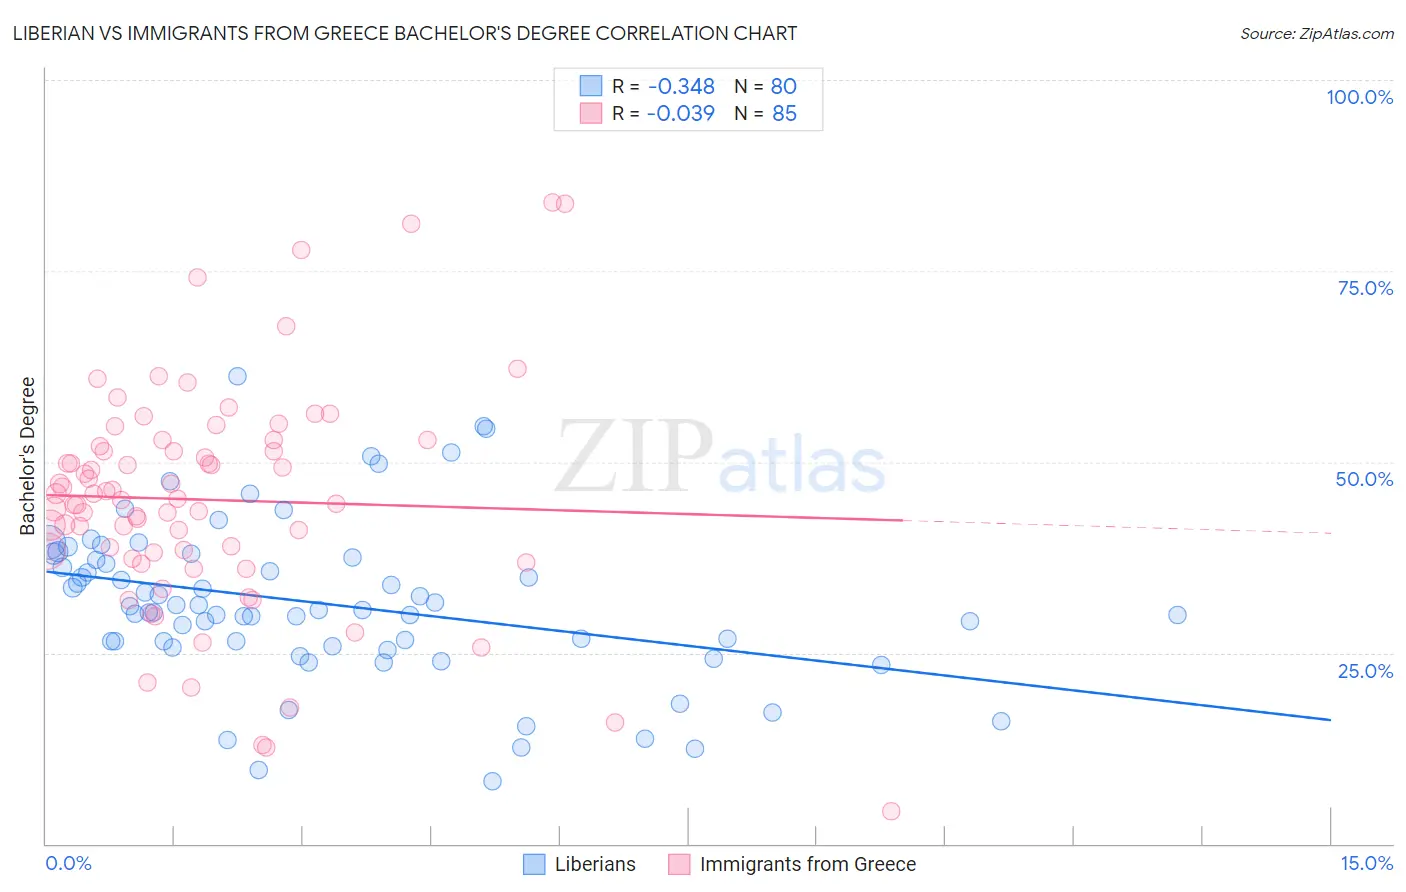
Liberian vs Immigrants from Greece Bachelor's Degree Correlation Chart
The statistical analysis conducted on geographies consisting of 118,099,075 people shows a mild negative correlation between the proportion of Liberians and percentage of population with at least bachelor's degree education in the United States with a correlation coefficient (R) of -0.348 and weighted average of 34.6%. Similarly, the statistical analysis conducted on geographies consisting of 216,876,242 people shows no correlation between the proportion of Immigrants from Greece and percentage of population with at least bachelor's degree education in the United States with a correlation coefficient (R) of -0.039 and weighted average of 44.5%, a difference of 28.6%.
Bachelor's Degree Correlation Summary
| Measurement | Liberian | Immigrants from Greece |
| Minimum | 8.2% | 4.3% |
| Maximum | 61.3% | 83.9% |
| Range | 53.0% | 79.6% |
| Mean | 31.5% | 45.0% |
| Median | 30.6% | 45.2% |
| Interquartile 25% (IQ1) | 26.1% | 37.8% |
| Interquartile 75% (IQ3) | 37.3% | 52.4% |
| Interquartile Range (IQR) | 11.2% | 14.6% |
| Standard Deviation (Sample) | 10.5% | 14.9% |
| Standard Deviation (Population) | 10.4% | 14.8% |
Similar Demographics by Bachelor's Degree
Demographics Similar to Liberians by Bachelor's Degree
In terms of bachelor's degree, the demographic groups most similar to Liberians are Tlingit-Haida (34.6%, a difference of 0.040%), Immigrants from West Indies (34.6%, a difference of 0.11%), Guamanian/Chamorro (34.6%, a difference of 0.20%), Guyanese (34.5%, a difference of 0.32%), and British West Indian (34.5%, a difference of 0.34%).
| Demographics | Rating | Rank | Bachelor's Degree |
| Whites/Caucasians | 5.9 /100 | #229 | Tragic 35.3% |
| Immigrants | Grenada | 4.3 /100 | #230 | Tragic 35.0% |
| Immigrants | St. Vincent and the Grenadines | 4.3 /100 | #231 | Tragic 35.0% |
| Hmong | 3.4 /100 | #232 | Tragic 34.8% |
| Immigrants | Ecuador | 3.3 /100 | #233 | Tragic 34.7% |
| Guamanians/Chamorros | 3.0 /100 | #234 | Tragic 34.6% |
| Immigrants | West Indies | 2.9 /100 | #235 | Tragic 34.6% |
| Liberians | 2.8 /100 | #236 | Tragic 34.6% |
| Tlingit-Haida | 2.8 /100 | #237 | Tragic 34.6% |
| Guyanese | 2.5 /100 | #238 | Tragic 34.5% |
| British West Indians | 2.5 /100 | #239 | Tragic 34.5% |
| Tongans | 2.0 /100 | #240 | Tragic 34.3% |
| Immigrants | Cambodia | 1.9 /100 | #241 | Tragic 34.2% |
| Immigrants | Nonimmigrants | 1.8 /100 | #242 | Tragic 34.2% |
| Immigrants | Guyana | 1.4 /100 | #243 | Tragic 33.9% |
Demographics Similar to Immigrants from Greece by Bachelor's Degree
In terms of bachelor's degree, the demographic groups most similar to Immigrants from Greece are Immigrants from Norway (44.5%, a difference of 0.12%), Asian (44.4%, a difference of 0.14%), Bolivian (44.6%, a difference of 0.24%), Estonian (44.6%, a difference of 0.24%), and Immigrants from Bulgaria (44.6%, a difference of 0.28%).
| Demographics | Rating | Rank | Bachelor's Degree |
| Immigrants | South Africa | 99.9 /100 | #43 | Exceptional 44.8% |
| Immigrants | Lithuania | 99.9 /100 | #44 | Exceptional 44.6% |
| Immigrants | Kuwait | 99.9 /100 | #45 | Exceptional 44.6% |
| Immigrants | Bulgaria | 99.9 /100 | #46 | Exceptional 44.6% |
| Bolivians | 99.9 /100 | #47 | Exceptional 44.6% |
| Estonians | 99.9 /100 | #48 | Exceptional 44.6% |
| Immigrants | Norway | 99.9 /100 | #49 | Exceptional 44.5% |
| Immigrants | Greece | 99.9 /100 | #50 | Exceptional 44.5% |
| Asians | 99.9 /100 | #51 | Exceptional 44.4% |
| Immigrants | Spain | 99.9 /100 | #52 | Exceptional 44.3% |
| Immigrants | Asia | 99.9 /100 | #53 | Exceptional 44.3% |
| Immigrants | Austria | 99.9 /100 | #54 | Exceptional 44.2% |
| Immigrants | Bolivia | 99.9 /100 | #55 | Exceptional 44.2% |
| Immigrants | Serbia | 99.9 /100 | #56 | Exceptional 44.1% |
| Paraguayans | 99.9 /100 | #57 | Exceptional 44.0% |