Lebanese vs Guamanian/Chamorro Hearing Disability
COMPARE
Lebanese
Guamanian/Chamorro
Hearing Disability
Hearing Disability Comparison
Lebanese
Guamanians/Chamorros
3.2%
HEARING DISABILITY
5.0/ 100
METRIC RATING
226th/ 347
METRIC RANK
3.3%
HEARING DISABILITY
2.2/ 100
METRIC RATING
235th/ 347
METRIC RANK
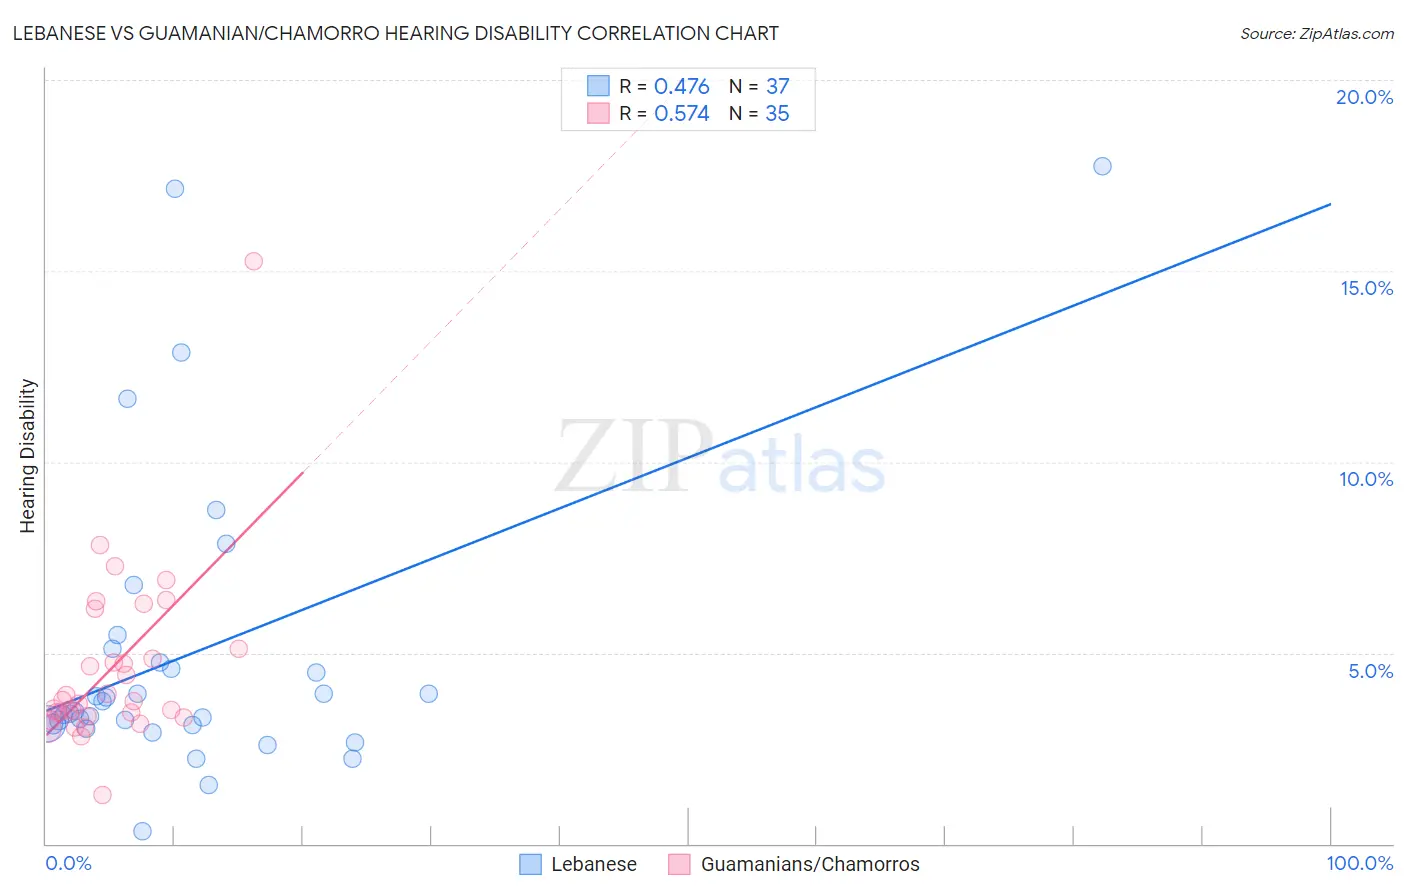
Lebanese vs Guamanian/Chamorro Hearing Disability Correlation Chart
The statistical analysis conducted on geographies consisting of 401,493,679 people shows a moderate positive correlation between the proportion of Lebanese and percentage of population with hearing disability in the United States with a correlation coefficient (R) of 0.476 and weighted average of 3.2%. Similarly, the statistical analysis conducted on geographies consisting of 221,861,125 people shows a substantial positive correlation between the proportion of Guamanians/Chamorros and percentage of population with hearing disability in the United States with a correlation coefficient (R) of 0.574 and weighted average of 3.3%, a difference of 1.8%.
Hearing Disability Correlation Summary
| Measurement | Lebanese | Guamanian/Chamorro |
| Minimum | 0.31% | 1.3% |
| Maximum | 17.8% | 15.2% |
| Range | 17.4% | 14.0% |
| Mean | 5.0% | 4.6% |
| Median | 3.5% | 3.7% |
| Interquartile 25% (IQ1) | 3.1% | 3.3% |
| Interquartile 75% (IQ3) | 4.9% | 5.1% |
| Interquartile Range (IQR) | 1.8% | 1.8% |
| Standard Deviation (Sample) | 3.9% | 2.4% |
| Standard Deviation (Population) | 3.9% | 2.3% |
Demographics Similar to Lebanese and Guamanians/Chamorros by Hearing Disability
In terms of hearing disability, the demographic groups most similar to Lebanese are Latvian (3.2%, a difference of 0.040%), Icelander (3.2%, a difference of 0.090%), Bhutanese (3.2%, a difference of 0.18%), Mexican (3.2%, a difference of 0.25%), and Immigrants from Portugal (3.2%, a difference of 0.38%). Similarly, the demographic groups most similar to Guamanians/Chamorros are Serbian (3.3%, a difference of 0.060%), Central American Indian (3.3%, a difference of 0.10%), Estonian (3.3%, a difference of 0.17%), Immigrants from Austria (3.3%, a difference of 0.46%), and German Russian (3.3%, a difference of 0.46%).
| Demographics | Rating | Rank | Hearing Disability |
| Malaysians | 6.6 /100 | #220 | Tragic 3.2% |
| Immigrants | Laos | 6.6 /100 | #221 | Tragic 3.2% |
| Immigrants | Oceania | 6.5 /100 | #222 | Tragic 3.2% |
| Mexicans | 5.6 /100 | #223 | Tragic 3.2% |
| Icelanders | 5.2 /100 | #224 | Tragic 3.2% |
| Latvians | 5.1 /100 | #225 | Tragic 3.2% |
| Lebanese | 5.0 /100 | #226 | Tragic 3.2% |
| Bhutanese | 4.6 /100 | #227 | Tragic 3.2% |
| Immigrants | Portugal | 4.3 /100 | #228 | Tragic 3.2% |
| Maltese | 4.1 /100 | #229 | Tragic 3.2% |
| Greeks | 3.2 /100 | #230 | Tragic 3.2% |
| Luxembourgers | 2.9 /100 | #231 | Tragic 3.2% |
| Ukrainians | 2.9 /100 | #232 | Tragic 3.2% |
| Estonians | 2.4 /100 | #233 | Tragic 3.3% |
| Central American Indians | 2.3 /100 | #234 | Tragic 3.3% |
| Guamanians/Chamorros | 2.2 /100 | #235 | Tragic 3.3% |
| Serbians | 2.2 /100 | #236 | Tragic 3.3% |
| Immigrants | Austria | 1.8 /100 | #237 | Tragic 3.3% |
| German Russians | 1.8 /100 | #238 | Tragic 3.3% |
| Nepalese | 1.2 /100 | #239 | Tragic 3.3% |
| Immigrants | Netherlands | 1.1 /100 | #240 | Tragic 3.3% |