Lebanese vs Immigrants from Liberia Hearing Disability
COMPARE
Lebanese
Immigrants from Liberia
Hearing Disability
Hearing Disability Comparison
Lebanese
Immigrants from Liberia
3.2%
HEARING DISABILITY
5.0/ 100
METRIC RATING
226th/ 347
METRIC RANK
2.8%
HEARING DISABILITY
90.0/ 100
METRIC RATING
117th/ 347
METRIC RANK
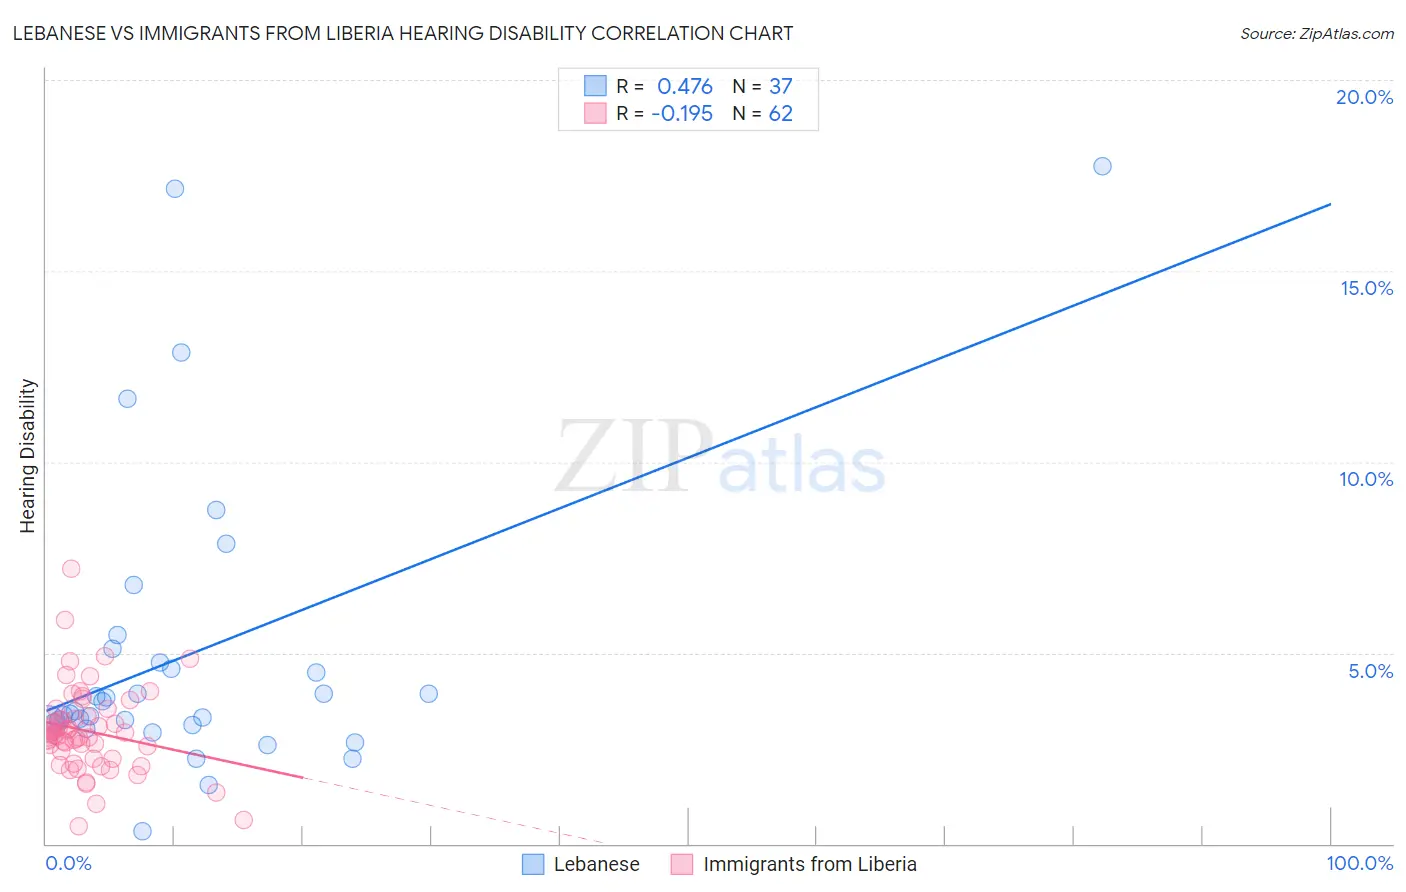
Lebanese vs Immigrants from Liberia Hearing Disability Correlation Chart
The statistical analysis conducted on geographies consisting of 401,493,679 people shows a moderate positive correlation between the proportion of Lebanese and percentage of population with hearing disability in the United States with a correlation coefficient (R) of 0.476 and weighted average of 3.2%. Similarly, the statistical analysis conducted on geographies consisting of 135,218,805 people shows a poor negative correlation between the proportion of Immigrants from Liberia and percentage of population with hearing disability in the United States with a correlation coefficient (R) of -0.195 and weighted average of 2.8%, a difference of 12.7%.
Hearing Disability Correlation Summary
| Measurement | Lebanese | Immigrants from Liberia |
| Minimum | 0.31% | 0.44% |
| Maximum | 17.8% | 7.2% |
| Range | 17.4% | 6.7% |
| Mean | 5.0% | 3.0% |
| Median | 3.5% | 2.8% |
| Interquartile 25% (IQ1) | 3.1% | 2.2% |
| Interquartile 75% (IQ3) | 4.9% | 3.3% |
| Interquartile Range (IQR) | 1.8% | 1.1% |
| Standard Deviation (Sample) | 3.9% | 1.1% |
| Standard Deviation (Population) | 3.9% | 1.1% |
Similar Demographics by Hearing Disability
Demographics Similar to Lebanese by Hearing Disability
In terms of hearing disability, the demographic groups most similar to Lebanese are Latvian (3.2%, a difference of 0.040%), Icelander (3.2%, a difference of 0.090%), Bhutanese (3.2%, a difference of 0.18%), Mexican (3.2%, a difference of 0.25%), and Immigrants from Portugal (3.2%, a difference of 0.38%).
| Demographics | Rating | Rank | Hearing Disability |
| New Zealanders | 6.8 /100 | #219 | Tragic 3.2% |
| Malaysians | 6.6 /100 | #220 | Tragic 3.2% |
| Immigrants | Laos | 6.6 /100 | #221 | Tragic 3.2% |
| Immigrants | Oceania | 6.5 /100 | #222 | Tragic 3.2% |
| Mexicans | 5.6 /100 | #223 | Tragic 3.2% |
| Icelanders | 5.2 /100 | #224 | Tragic 3.2% |
| Latvians | 5.1 /100 | #225 | Tragic 3.2% |
| Lebanese | 5.0 /100 | #226 | Tragic 3.2% |
| Bhutanese | 4.6 /100 | #227 | Tragic 3.2% |
| Immigrants | Portugal | 4.3 /100 | #228 | Tragic 3.2% |
| Maltese | 4.1 /100 | #229 | Tragic 3.2% |
| Greeks | 3.2 /100 | #230 | Tragic 3.2% |
| Luxembourgers | 2.9 /100 | #231 | Tragic 3.2% |
| Ukrainians | 2.9 /100 | #232 | Tragic 3.2% |
| Estonians | 2.4 /100 | #233 | Tragic 3.3% |
Demographics Similar to Immigrants from Liberia by Hearing Disability
In terms of hearing disability, the demographic groups most similar to Immigrants from Liberia are Zimbabwean (2.8%, a difference of 0.010%), Kenyan (2.8%, a difference of 0.030%), Immigrants (2.8%, a difference of 0.090%), Jordanian (2.8%, a difference of 0.13%), and Immigrants from Latin America (2.8%, a difference of 0.15%).
| Demographics | Rating | Rank | Hearing Disability |
| Cypriots | 92.9 /100 | #110 | Exceptional 2.8% |
| Immigrants | Yemen | 92.7 /100 | #111 | Exceptional 2.8% |
| U.S. Virgin Islanders | 92.5 /100 | #112 | Exceptional 2.8% |
| Immigrants | Belarus | 91.6 /100 | #113 | Exceptional 2.8% |
| Cambodians | 91.1 /100 | #114 | Exceptional 2.8% |
| Immigrants | Latin America | 90.5 /100 | #115 | Exceptional 2.8% |
| Immigrants | Immigrants | 90.3 /100 | #116 | Exceptional 2.8% |
| Immigrants | Liberia | 90.0 /100 | #117 | Excellent 2.8% |
| Zimbabweans | 89.9 /100 | #118 | Excellent 2.8% |
| Kenyans | 89.8 /100 | #119 | Excellent 2.8% |
| Jordanians | 89.5 /100 | #120 | Excellent 2.8% |
| Cubans | 89.4 /100 | #121 | Excellent 2.8% |
| Liberians | 89.0 /100 | #122 | Excellent 2.8% |
| Immigrants | Zaire | 88.6 /100 | #123 | Excellent 2.9% |
| Bahamians | 88.6 /100 | #124 | Excellent 2.9% |