Lebanese vs British West Indian Hearing Disability
COMPARE
Lebanese
British West Indian
Hearing Disability
Hearing Disability Comparison
Lebanese
British West Indians
3.2%
HEARING DISABILITY
5.0/ 100
METRIC RATING
226th/ 347
METRIC RANK
2.4%
HEARING DISABILITY
100.0/ 100
METRIC RATING
8th/ 347
METRIC RANK
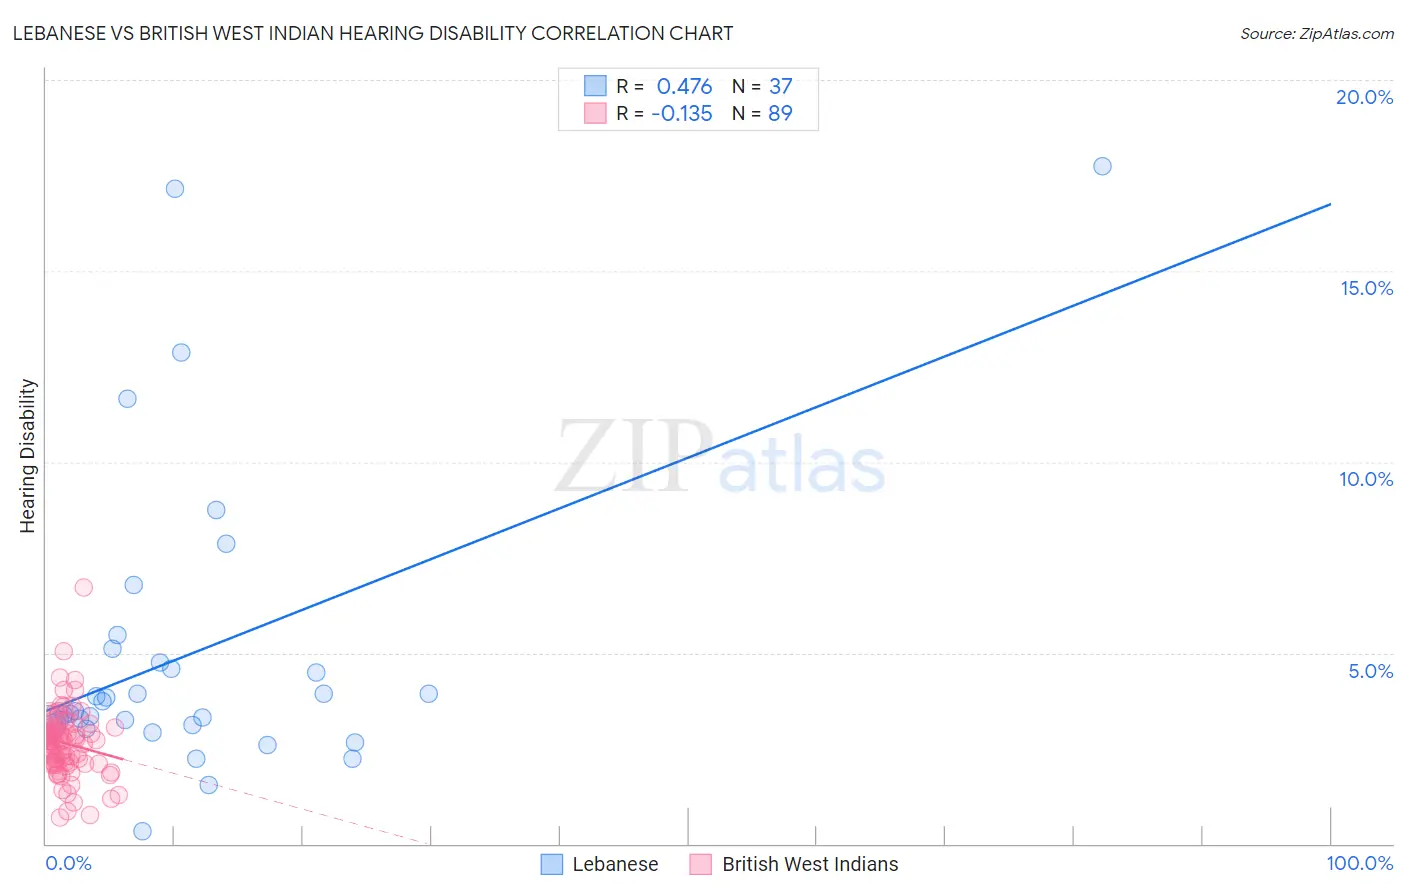
Lebanese vs British West Indian Hearing Disability Correlation Chart
The statistical analysis conducted on geographies consisting of 401,493,679 people shows a moderate positive correlation between the proportion of Lebanese and percentage of population with hearing disability in the United States with a correlation coefficient (R) of 0.476 and weighted average of 3.2%. Similarly, the statistical analysis conducted on geographies consisting of 152,668,246 people shows a poor negative correlation between the proportion of British West Indians and percentage of population with hearing disability in the United States with a correlation coefficient (R) of -0.135 and weighted average of 2.4%, a difference of 31.8%.
Hearing Disability Correlation Summary
| Measurement | Lebanese | British West Indian |
| Minimum | 0.31% | 0.70% |
| Maximum | 17.8% | 6.7% |
| Range | 17.4% | 6.0% |
| Mean | 5.0% | 2.6% |
| Median | 3.5% | 2.7% |
| Interquartile 25% (IQ1) | 3.1% | 2.1% |
| Interquartile 75% (IQ3) | 4.9% | 3.0% |
| Interquartile Range (IQR) | 1.8% | 0.87% |
| Standard Deviation (Sample) | 3.9% | 0.90% |
| Standard Deviation (Population) | 3.9% | 0.89% |
Similar Demographics by Hearing Disability
Demographics Similar to Lebanese by Hearing Disability
In terms of hearing disability, the demographic groups most similar to Lebanese are Latvian (3.2%, a difference of 0.040%), Icelander (3.2%, a difference of 0.090%), Bhutanese (3.2%, a difference of 0.18%), Mexican (3.2%, a difference of 0.25%), and Immigrants from Portugal (3.2%, a difference of 0.38%).
| Demographics | Rating | Rank | Hearing Disability |
| New Zealanders | 6.8 /100 | #219 | Tragic 3.2% |
| Malaysians | 6.6 /100 | #220 | Tragic 3.2% |
| Immigrants | Laos | 6.6 /100 | #221 | Tragic 3.2% |
| Immigrants | Oceania | 6.5 /100 | #222 | Tragic 3.2% |
| Mexicans | 5.6 /100 | #223 | Tragic 3.2% |
| Icelanders | 5.2 /100 | #224 | Tragic 3.2% |
| Latvians | 5.1 /100 | #225 | Tragic 3.2% |
| Lebanese | 5.0 /100 | #226 | Tragic 3.2% |
| Bhutanese | 4.6 /100 | #227 | Tragic 3.2% |
| Immigrants | Portugal | 4.3 /100 | #228 | Tragic 3.2% |
| Maltese | 4.1 /100 | #229 | Tragic 3.2% |
| Greeks | 3.2 /100 | #230 | Tragic 3.2% |
| Luxembourgers | 2.9 /100 | #231 | Tragic 3.2% |
| Ukrainians | 2.9 /100 | #232 | Tragic 3.2% |
| Estonians | 2.4 /100 | #233 | Tragic 3.3% |
Demographics Similar to British West Indians by Hearing Disability
In terms of hearing disability, the demographic groups most similar to British West Indians are Immigrants from Bangladesh (2.4%, a difference of 0.22%), Immigrants from Dominican Republic (2.4%, a difference of 0.78%), Vietnamese (2.4%, a difference of 1.8%), Immigrants from Ecuador (2.5%, a difference of 1.8%), and Immigrants from Trinidad and Tobago (2.5%, a difference of 2.4%).
| Demographics | Rating | Rank | Hearing Disability |
| Immigrants | Grenada | 100.0 /100 | #1 | Exceptional 2.2% |
| Immigrants | St. Vincent and the Grenadines | 100.0 /100 | #2 | Exceptional 2.3% |
| Guyanese | 100.0 /100 | #3 | Exceptional 2.3% |
| Immigrants | Guyana | 100.0 /100 | #4 | Exceptional 2.3% |
| Immigrants | Barbados | 100.0 /100 | #5 | Exceptional 2.4% |
| Vietnamese | 100.0 /100 | #6 | Exceptional 2.4% |
| Immigrants | Bangladesh | 100.0 /100 | #7 | Exceptional 2.4% |
| British West Indians | 100.0 /100 | #8 | Exceptional 2.4% |
| Immigrants | Dominican Republic | 100.0 /100 | #9 | Exceptional 2.4% |
| Immigrants | Ecuador | 99.9 /100 | #10 | Exceptional 2.5% |
| Immigrants | Trinidad and Tobago | 99.9 /100 | #11 | Exceptional 2.5% |
| Trinidadians and Tobagonians | 99.9 /100 | #12 | Exceptional 2.5% |
| Sierra Leoneans | 99.9 /100 | #13 | Exceptional 2.5% |
| Ecuadorians | 99.9 /100 | #14 | Exceptional 2.5% |
| Barbadians | 99.9 /100 | #15 | Exceptional 2.5% |