Latvian vs Immigrants from Afghanistan Vision Disability
COMPARE
Latvian
Immigrants from Afghanistan
Vision Disability
Vision Disability Comparison
Latvians
Immigrants from Afghanistan
2.0%
VISION DISABILITY
99.5/ 100
METRIC RATING
49th/ 347
METRIC RANK
2.1%
VISION DISABILITY
95.6/ 100
METRIC RATING
97th/ 347
METRIC RANK
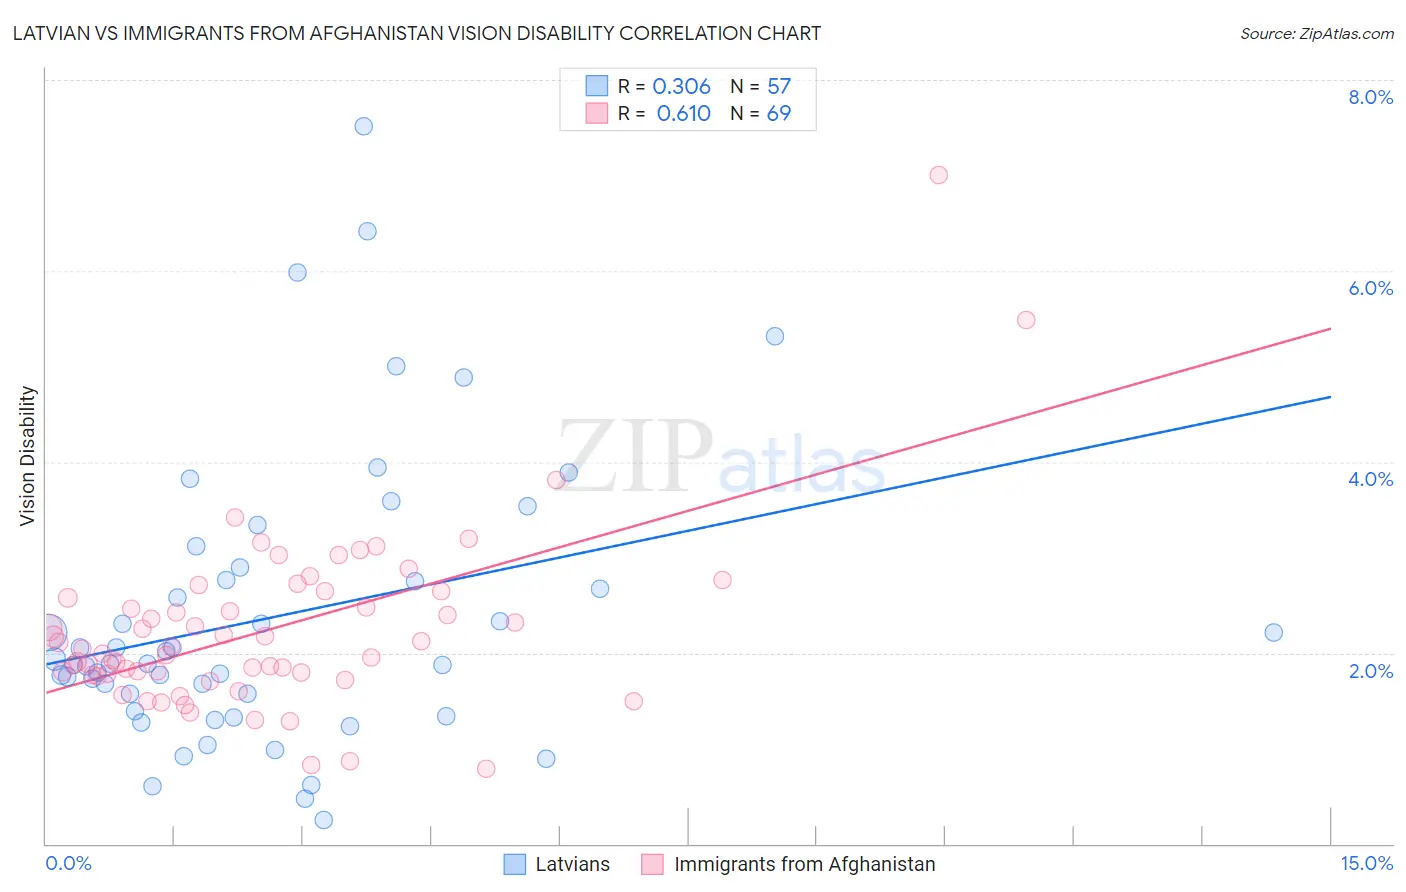
Latvian vs Immigrants from Afghanistan Vision Disability Correlation Chart
The statistical analysis conducted on geographies consisting of 220,626,631 people shows a mild positive correlation between the proportion of Latvians and percentage of population with vision disability in the United States with a correlation coefficient (R) of 0.306 and weighted average of 2.0%. Similarly, the statistical analysis conducted on geographies consisting of 147,616,042 people shows a significant positive correlation between the proportion of Immigrants from Afghanistan and percentage of population with vision disability in the United States with a correlation coefficient (R) of 0.610 and weighted average of 2.1%, a difference of 3.9%.
Vision Disability Correlation Summary
| Measurement | Latvian | Immigrants from Afghanistan |
| Minimum | 0.25% | 0.79% |
| Maximum | 7.5% | 7.0% |
| Range | 7.3% | 6.2% |
| Mean | 2.4% | 2.2% |
| Median | 1.9% | 2.0% |
| Interquartile 25% (IQ1) | 1.5% | 1.8% |
| Interquartile 75% (IQ3) | 2.8% | 2.6% |
| Interquartile Range (IQR) | 1.3% | 0.84% |
| Standard Deviation (Sample) | 1.5% | 0.93% |
| Standard Deviation (Population) | 1.5% | 0.93% |
Similar Demographics by Vision Disability
Demographics Similar to Latvians by Vision Disability
In terms of vision disability, the demographic groups most similar to Latvians are Afghan (2.0%, a difference of 0.060%), Israeli (2.0%, a difference of 0.070%), Tongan (2.0%, a difference of 0.15%), Immigrants from Serbia (2.0%, a difference of 0.46%), and Immigrants from Bulgaria (2.0%, a difference of 0.52%).
| Demographics | Rating | Rank | Vision Disability |
| Immigrants | Ethiopia | 99.7 /100 | #42 | Exceptional 2.0% |
| Eastern Europeans | 99.7 /100 | #43 | Exceptional 2.0% |
| Immigrants | Indonesia | 99.7 /100 | #44 | Exceptional 2.0% |
| Ethiopians | 99.7 /100 | #45 | Exceptional 2.0% |
| Immigrants | Sweden | 99.7 /100 | #46 | Exceptional 2.0% |
| Immigrants | Bulgaria | 99.7 /100 | #47 | Exceptional 2.0% |
| Israelis | 99.6 /100 | #48 | Exceptional 2.0% |
| Latvians | 99.5 /100 | #49 | Exceptional 2.0% |
| Afghans | 99.5 /100 | #50 | Exceptional 2.0% |
| Tongans | 99.5 /100 | #51 | Exceptional 2.0% |
| Immigrants | Serbia | 99.4 /100 | #52 | Exceptional 2.0% |
| Immigrants | Belarus | 99.3 /100 | #53 | Exceptional 2.0% |
| Macedonians | 99.3 /100 | #54 | Exceptional 2.0% |
| Laotians | 99.3 /100 | #55 | Exceptional 2.0% |
| Jordanians | 99.2 /100 | #56 | Exceptional 2.0% |
Demographics Similar to Immigrants from Afghanistan by Vision Disability
In terms of vision disability, the demographic groups most similar to Immigrants from Afghanistan are Immigrants from South Africa (2.1%, a difference of 0.050%), Romanian (2.1%, a difference of 0.070%), Estonian (2.1%, a difference of 0.12%), Australian (2.1%, a difference of 0.13%), and Greek (2.1%, a difference of 0.16%).
| Demographics | Rating | Rank | Vision Disability |
| Immigrants | Lebanon | 96.7 /100 | #90 | Exceptional 2.1% |
| Immigrants | Somalia | 96.2 /100 | #91 | Exceptional 2.1% |
| Immigrants | Syria | 96.2 /100 | #92 | Exceptional 2.1% |
| Immigrants | Europe | 96.1 /100 | #93 | Exceptional 2.1% |
| Immigrants | Croatia | 96.0 /100 | #94 | Exceptional 2.1% |
| Australians | 95.9 /100 | #95 | Exceptional 2.1% |
| Romanians | 95.7 /100 | #96 | Exceptional 2.1% |
| Immigrants | Afghanistan | 95.6 /100 | #97 | Exceptional 2.1% |
| Immigrants | South Africa | 95.4 /100 | #98 | Exceptional 2.1% |
| Estonians | 95.3 /100 | #99 | Exceptional 2.1% |
| Greeks | 95.1 /100 | #100 | Exceptional 2.1% |
| Albanians | 94.9 /100 | #101 | Exceptional 2.1% |
| Sri Lankans | 94.8 /100 | #102 | Exceptional 2.1% |
| Immigrants | Austria | 94.4 /100 | #103 | Exceptional 2.1% |
| Immigrants | Italy | 94.4 /100 | #104 | Exceptional 2.1% |