Yakama vs Immigrants from Afghanistan Vision Disability
COMPARE
Yakama
Immigrants from Afghanistan
Vision Disability
Vision Disability Comparison
Yakama
Immigrants from Afghanistan
2.5%
VISION DISABILITY
0.0/ 100
METRIC RATING
284th/ 347
METRIC RANK
2.1%
VISION DISABILITY
95.6/ 100
METRIC RATING
97th/ 347
METRIC RANK
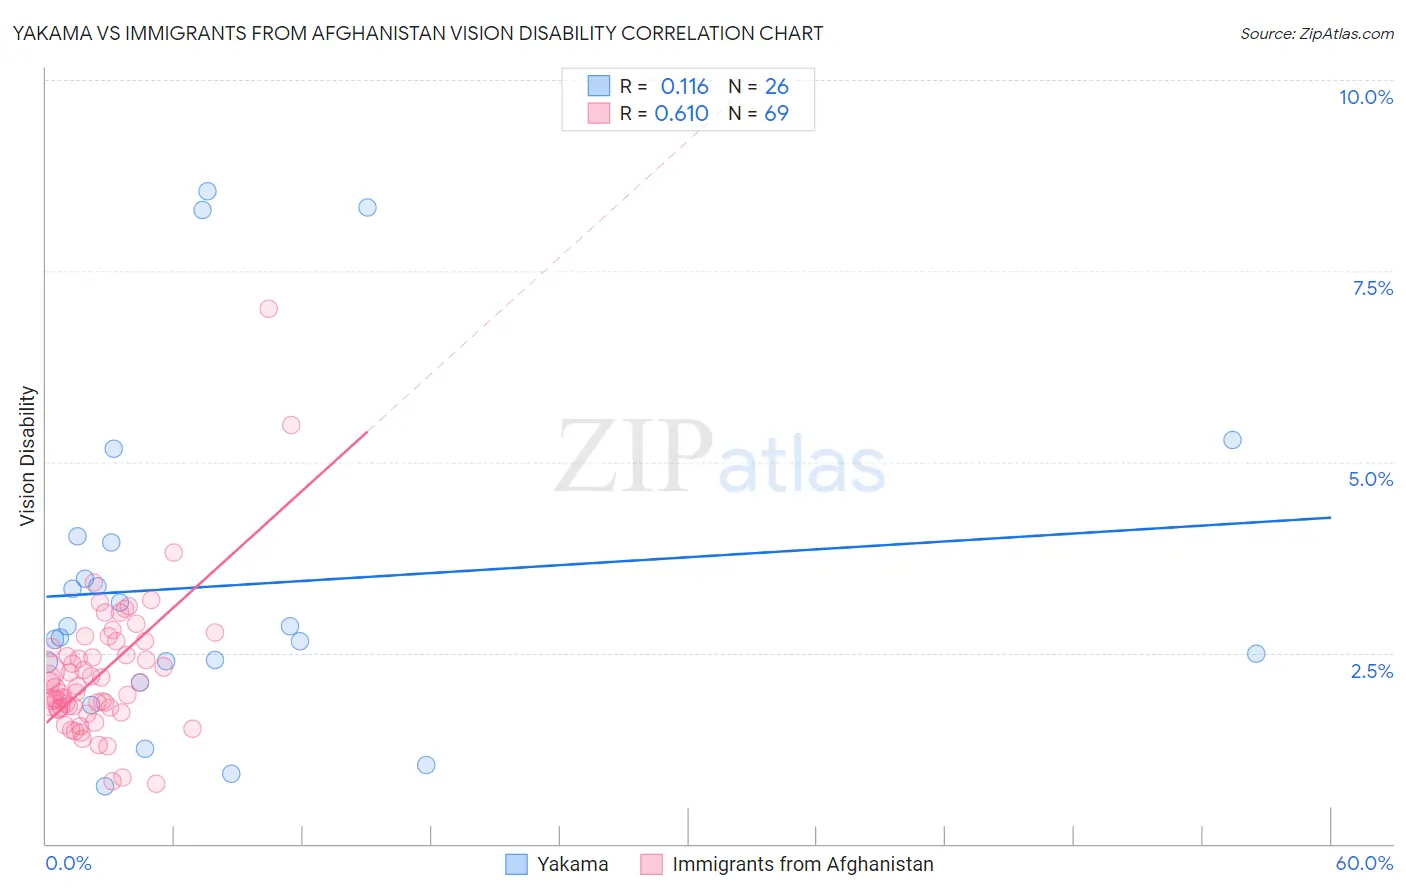
Yakama vs Immigrants from Afghanistan Vision Disability Correlation Chart
The statistical analysis conducted on geographies consisting of 19,916,701 people shows a poor positive correlation between the proportion of Yakama and percentage of population with vision disability in the United States with a correlation coefficient (R) of 0.116 and weighted average of 2.5%. Similarly, the statistical analysis conducted on geographies consisting of 147,616,042 people shows a significant positive correlation between the proportion of Immigrants from Afghanistan and percentage of population with vision disability in the United States with a correlation coefficient (R) of 0.610 and weighted average of 2.1%, a difference of 19.6%.
Vision Disability Correlation Summary
| Measurement | Yakama | Immigrants from Afghanistan |
| Minimum | 0.75% | 0.79% |
| Maximum | 8.5% | 7.0% |
| Range | 7.8% | 6.2% |
| Mean | 3.4% | 2.2% |
| Median | 2.8% | 2.0% |
| Interquartile 25% (IQ1) | 2.4% | 1.8% |
| Interquartile 75% (IQ3) | 3.9% | 2.6% |
| Interquartile Range (IQR) | 1.6% | 0.84% |
| Standard Deviation (Sample) | 2.2% | 0.93% |
| Standard Deviation (Population) | 2.1% | 0.93% |
Similar Demographics by Vision Disability
Demographics Similar to Yakama by Vision Disability
In terms of vision disability, the demographic groups most similar to Yakama are Immigrants from Central America (2.5%, a difference of 0.010%), Sioux (2.5%, a difference of 0.030%), Honduran (2.5%, a difference of 0.17%), French American Indian (2.5%, a difference of 0.19%), and Puget Sound Salish (2.5%, a difference of 0.28%).
| Demographics | Rating | Rank | Vision Disability |
| Bahamians | 0.0 /100 | #277 | Tragic 2.4% |
| Spanish | 0.0 /100 | #278 | Tragic 2.4% |
| Nepalese | 0.0 /100 | #279 | Tragic 2.4% |
| Cape Verdeans | 0.0 /100 | #280 | Tragic 2.4% |
| U.S. Virgin Islanders | 0.0 /100 | #281 | Tragic 2.5% |
| Immigrants | Caribbean | 0.0 /100 | #282 | Tragic 2.5% |
| Puget Sound Salish | 0.0 /100 | #283 | Tragic 2.5% |
| Yakama | 0.0 /100 | #284 | Tragic 2.5% |
| Immigrants | Central America | 0.0 /100 | #285 | Tragic 2.5% |
| Sioux | 0.0 /100 | #286 | Tragic 2.5% |
| Hondurans | 0.0 /100 | #287 | Tragic 2.5% |
| French American Indians | 0.0 /100 | #288 | Tragic 2.5% |
| Immigrants | Nonimmigrants | 0.0 /100 | #289 | Tragic 2.5% |
| Immigrants | Cuba | 0.0 /100 | #290 | Tragic 2.5% |
| Immigrants | Honduras | 0.0 /100 | #291 | Tragic 2.5% |
Demographics Similar to Immigrants from Afghanistan by Vision Disability
In terms of vision disability, the demographic groups most similar to Immigrants from Afghanistan are Immigrants from South Africa (2.1%, a difference of 0.050%), Romanian (2.1%, a difference of 0.070%), Estonian (2.1%, a difference of 0.12%), Australian (2.1%, a difference of 0.13%), and Greek (2.1%, a difference of 0.16%).
| Demographics | Rating | Rank | Vision Disability |
| Immigrants | Lebanon | 96.7 /100 | #90 | Exceptional 2.1% |
| Immigrants | Somalia | 96.2 /100 | #91 | Exceptional 2.1% |
| Immigrants | Syria | 96.2 /100 | #92 | Exceptional 2.1% |
| Immigrants | Europe | 96.1 /100 | #93 | Exceptional 2.1% |
| Immigrants | Croatia | 96.0 /100 | #94 | Exceptional 2.1% |
| Australians | 95.9 /100 | #95 | Exceptional 2.1% |
| Romanians | 95.7 /100 | #96 | Exceptional 2.1% |
| Immigrants | Afghanistan | 95.6 /100 | #97 | Exceptional 2.1% |
| Immigrants | South Africa | 95.4 /100 | #98 | Exceptional 2.1% |
| Estonians | 95.3 /100 | #99 | Exceptional 2.1% |
| Greeks | 95.1 /100 | #100 | Exceptional 2.1% |
| Albanians | 94.9 /100 | #101 | Exceptional 2.1% |
| Sri Lankans | 94.8 /100 | #102 | Exceptional 2.1% |
| Immigrants | Austria | 94.4 /100 | #103 | Exceptional 2.1% |
| Immigrants | Italy | 94.4 /100 | #104 | Exceptional 2.1% |