Spaniard vs Immigrants from Afghanistan Vision Disability
COMPARE
Spaniard
Immigrants from Afghanistan
Vision Disability
Vision Disability Comparison
Spaniards
Immigrants from Afghanistan
2.4%
VISION DISABILITY
0.1/ 100
METRIC RATING
272nd/ 347
METRIC RANK
2.1%
VISION DISABILITY
95.6/ 100
METRIC RATING
97th/ 347
METRIC RANK
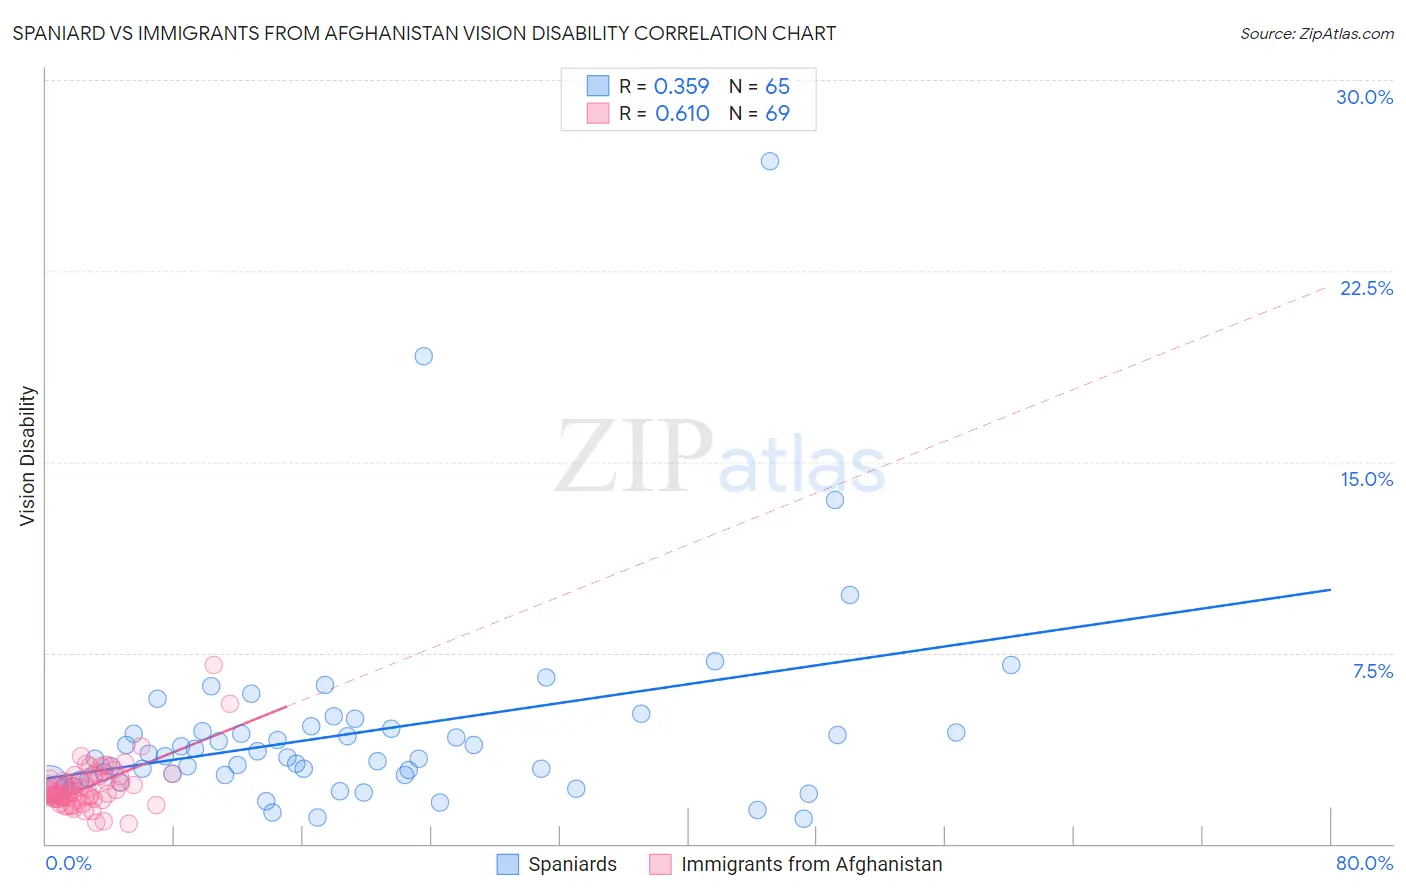
Spaniard vs Immigrants from Afghanistan Vision Disability Correlation Chart
The statistical analysis conducted on geographies consisting of 443,022,982 people shows a mild positive correlation between the proportion of Spaniards and percentage of population with vision disability in the United States with a correlation coefficient (R) of 0.359 and weighted average of 2.4%. Similarly, the statistical analysis conducted on geographies consisting of 147,616,042 people shows a significant positive correlation between the proportion of Immigrants from Afghanistan and percentage of population with vision disability in the United States with a correlation coefficient (R) of 0.610 and weighted average of 2.1%, a difference of 17.1%.
Vision Disability Correlation Summary
| Measurement | Spaniard | Immigrants from Afghanistan |
| Minimum | 0.97% | 0.79% |
| Maximum | 26.8% | 7.0% |
| Range | 25.9% | 6.2% |
| Mean | 4.4% | 2.2% |
| Median | 3.4% | 2.0% |
| Interquartile 25% (IQ1) | 2.5% | 1.8% |
| Interquartile 75% (IQ3) | 4.4% | 2.6% |
| Interquartile Range (IQR) | 1.9% | 0.84% |
| Standard Deviation (Sample) | 4.0% | 0.93% |
| Standard Deviation (Population) | 3.9% | 0.93% |
Similar Demographics by Vision Disability
Demographics Similar to Spaniards by Vision Disability
In terms of vision disability, the demographic groups most similar to Spaniards are Immigrants from the Azores (2.4%, a difference of 0.10%), Cuban (2.4%, a difference of 0.26%), Celtic (2.4%, a difference of 0.27%), Immigrants from Bahamas (2.4%, a difference of 0.33%), and Senegalese (2.4%, a difference of 0.54%).
| Demographics | Rating | Rank | Vision Disability |
| Immigrants | Jamaica | 0.1 /100 | #265 | Tragic 2.4% |
| Mexican American Indians | 0.1 /100 | #266 | Tragic 2.4% |
| Ute | 0.1 /100 | #267 | Tragic 2.4% |
| Senegalese | 0.1 /100 | #268 | Tragic 2.4% |
| Celtics | 0.1 /100 | #269 | Tragic 2.4% |
| Cubans | 0.1 /100 | #270 | Tragic 2.4% |
| Immigrants | Azores | 0.1 /100 | #271 | Tragic 2.4% |
| Spaniards | 0.1 /100 | #272 | Tragic 2.4% |
| Immigrants | Bahamas | 0.1 /100 | #273 | Tragic 2.4% |
| Immigrants | Latin America | 0.0 /100 | #274 | Tragic 2.4% |
| Chippewa | 0.0 /100 | #275 | Tragic 2.4% |
| Scotch-Irish | 0.0 /100 | #276 | Tragic 2.4% |
| Bahamians | 0.0 /100 | #277 | Tragic 2.4% |
| Spanish | 0.0 /100 | #278 | Tragic 2.4% |
| Nepalese | 0.0 /100 | #279 | Tragic 2.4% |
Demographics Similar to Immigrants from Afghanistan by Vision Disability
In terms of vision disability, the demographic groups most similar to Immigrants from Afghanistan are Immigrants from South Africa (2.1%, a difference of 0.050%), Romanian (2.1%, a difference of 0.070%), Estonian (2.1%, a difference of 0.12%), Australian (2.1%, a difference of 0.13%), and Greek (2.1%, a difference of 0.16%).
| Demographics | Rating | Rank | Vision Disability |
| Immigrants | Lebanon | 96.7 /100 | #90 | Exceptional 2.1% |
| Immigrants | Somalia | 96.2 /100 | #91 | Exceptional 2.1% |
| Immigrants | Syria | 96.2 /100 | #92 | Exceptional 2.1% |
| Immigrants | Europe | 96.1 /100 | #93 | Exceptional 2.1% |
| Immigrants | Croatia | 96.0 /100 | #94 | Exceptional 2.1% |
| Australians | 95.9 /100 | #95 | Exceptional 2.1% |
| Romanians | 95.7 /100 | #96 | Exceptional 2.1% |
| Immigrants | Afghanistan | 95.6 /100 | #97 | Exceptional 2.1% |
| Immigrants | South Africa | 95.4 /100 | #98 | Exceptional 2.1% |
| Estonians | 95.3 /100 | #99 | Exceptional 2.1% |
| Greeks | 95.1 /100 | #100 | Exceptional 2.1% |
| Albanians | 94.9 /100 | #101 | Exceptional 2.1% |
| Sri Lankans | 94.8 /100 | #102 | Exceptional 2.1% |
| Immigrants | Austria | 94.4 /100 | #103 | Exceptional 2.1% |
| Immigrants | Italy | 94.4 /100 | #104 | Exceptional 2.1% |