Tlingit-Haida vs Immigrants from Afghanistan Vision Disability
COMPARE
Tlingit-Haida
Immigrants from Afghanistan
Vision Disability
Vision Disability Comparison
Tlingit-Haida
Immigrants from Afghanistan
2.9%
VISION DISABILITY
0.0/ 100
METRIC RATING
323rd/ 347
METRIC RANK
2.1%
VISION DISABILITY
95.6/ 100
METRIC RATING
97th/ 347
METRIC RANK
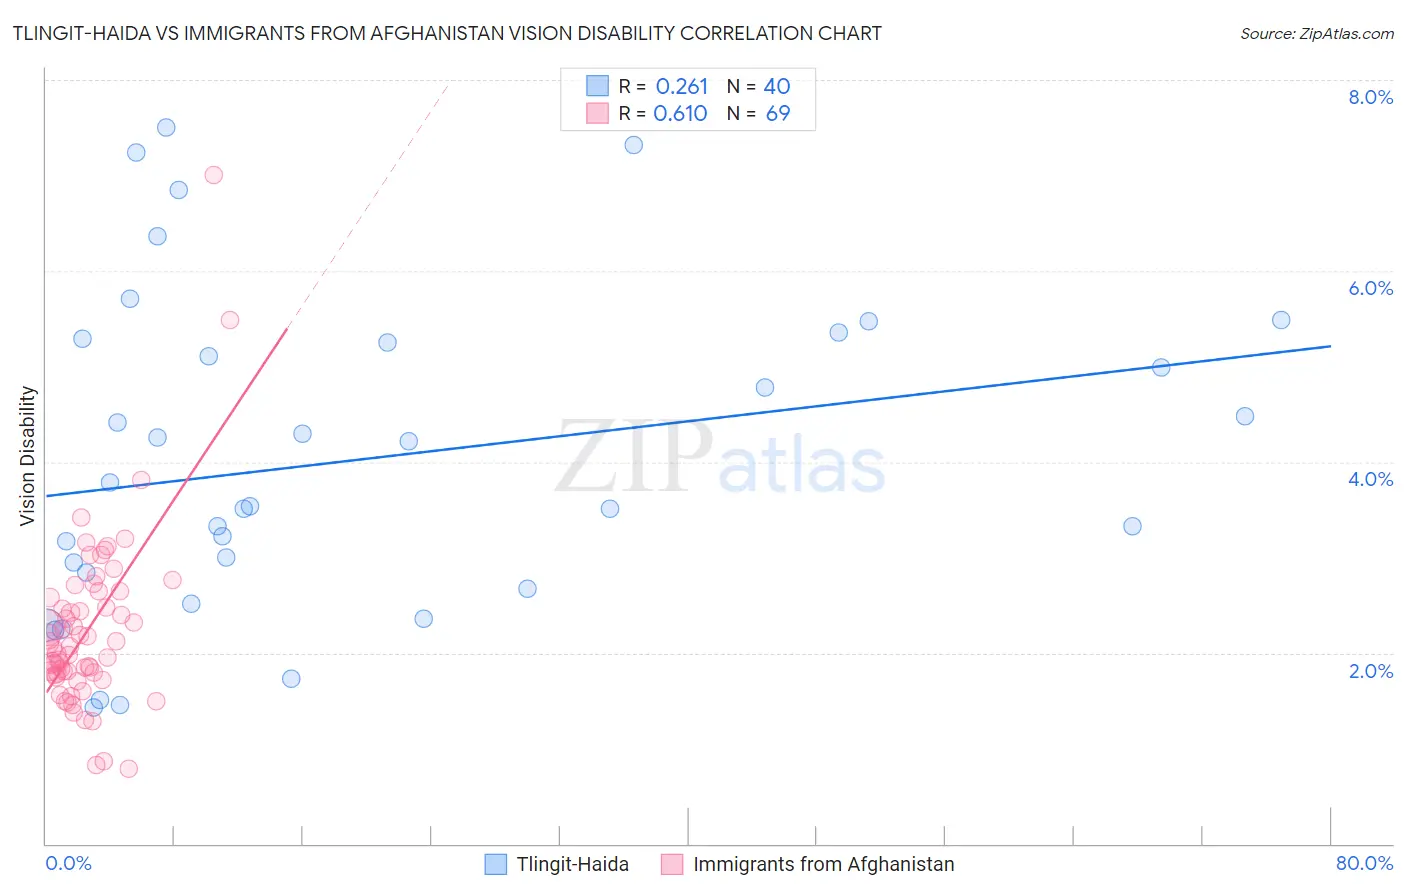
Tlingit-Haida vs Immigrants from Afghanistan Vision Disability Correlation Chart
The statistical analysis conducted on geographies consisting of 60,836,708 people shows a weak positive correlation between the proportion of Tlingit-Haida and percentage of population with vision disability in the United States with a correlation coefficient (R) of 0.261 and weighted average of 2.9%. Similarly, the statistical analysis conducted on geographies consisting of 147,616,042 people shows a significant positive correlation between the proportion of Immigrants from Afghanistan and percentage of population with vision disability in the United States with a correlation coefficient (R) of 0.610 and weighted average of 2.1%, a difference of 38.5%.
Vision Disability Correlation Summary
| Measurement | Tlingit-Haida | Immigrants from Afghanistan |
| Minimum | 1.4% | 0.79% |
| Maximum | 7.5% | 7.0% |
| Range | 6.1% | 6.2% |
| Mean | 4.0% | 2.2% |
| Median | 3.7% | 2.0% |
| Interquartile 25% (IQ1) | 2.8% | 1.8% |
| Interquartile 75% (IQ3) | 5.3% | 2.6% |
| Interquartile Range (IQR) | 2.5% | 0.84% |
| Standard Deviation (Sample) | 1.7% | 0.93% |
| Standard Deviation (Population) | 1.7% | 0.93% |
Similar Demographics by Vision Disability
Demographics Similar to Tlingit-Haida by Vision Disability
In terms of vision disability, the demographic groups most similar to Tlingit-Haida are Paiute (2.9%, a difference of 0.0%), Comanche (2.8%, a difference of 0.42%), Hopi (2.9%, a difference of 2.0%), Cherokee (2.9%, a difference of 2.0%), and Black/African American (2.8%, a difference of 2.5%).
| Demographics | Rating | Rank | Vision Disability |
| Shoshone | 0.0 /100 | #316 | Tragic 2.7% |
| Yup'ik | 0.0 /100 | #317 | Tragic 2.7% |
| Alaska Natives | 0.0 /100 | #318 | Tragic 2.7% |
| Tohono O'odham | 0.0 /100 | #319 | Tragic 2.8% |
| Blacks/African Americans | 0.0 /100 | #320 | Tragic 2.8% |
| Comanche | 0.0 /100 | #321 | Tragic 2.8% |
| Paiute | 0.0 /100 | #322 | Tragic 2.9% |
| Tlingit-Haida | 0.0 /100 | #323 | Tragic 2.9% |
| Hopi | 0.0 /100 | #324 | Tragic 2.9% |
| Cherokee | 0.0 /100 | #325 | Tragic 2.9% |
| Spanish Americans | 0.0 /100 | #326 | Tragic 2.9% |
| Natives/Alaskans | 0.0 /100 | #327 | Tragic 3.0% |
| Yuman | 0.0 /100 | #328 | Tragic 3.0% |
| Apache | 0.0 /100 | #329 | Tragic 3.0% |
| Colville | 0.0 /100 | #330 | Tragic 3.0% |
Demographics Similar to Immigrants from Afghanistan by Vision Disability
In terms of vision disability, the demographic groups most similar to Immigrants from Afghanistan are Immigrants from South Africa (2.1%, a difference of 0.050%), Romanian (2.1%, a difference of 0.070%), Estonian (2.1%, a difference of 0.12%), Australian (2.1%, a difference of 0.13%), and Greek (2.1%, a difference of 0.16%).
| Demographics | Rating | Rank | Vision Disability |
| Immigrants | Lebanon | 96.7 /100 | #90 | Exceptional 2.1% |
| Immigrants | Somalia | 96.2 /100 | #91 | Exceptional 2.1% |
| Immigrants | Syria | 96.2 /100 | #92 | Exceptional 2.1% |
| Immigrants | Europe | 96.1 /100 | #93 | Exceptional 2.1% |
| Immigrants | Croatia | 96.0 /100 | #94 | Exceptional 2.1% |
| Australians | 95.9 /100 | #95 | Exceptional 2.1% |
| Romanians | 95.7 /100 | #96 | Exceptional 2.1% |
| Immigrants | Afghanistan | 95.6 /100 | #97 | Exceptional 2.1% |
| Immigrants | South Africa | 95.4 /100 | #98 | Exceptional 2.1% |
| Estonians | 95.3 /100 | #99 | Exceptional 2.1% |
| Greeks | 95.1 /100 | #100 | Exceptional 2.1% |
| Albanians | 94.9 /100 | #101 | Exceptional 2.1% |
| Sri Lankans | 94.8 /100 | #102 | Exceptional 2.1% |
| Immigrants | Austria | 94.4 /100 | #103 | Exceptional 2.1% |
| Immigrants | Italy | 94.4 /100 | #104 | Exceptional 2.1% |