Okinawan vs Immigrants from Afghanistan Vision Disability
COMPARE
Okinawan
Immigrants from Afghanistan
Vision Disability
Vision Disability Comparison
Okinawans
Immigrants from Afghanistan
1.8%
VISION DISABILITY
100.0/ 100
METRIC RATING
5th/ 347
METRIC RANK
2.1%
VISION DISABILITY
95.6/ 100
METRIC RATING
97th/ 347
METRIC RANK
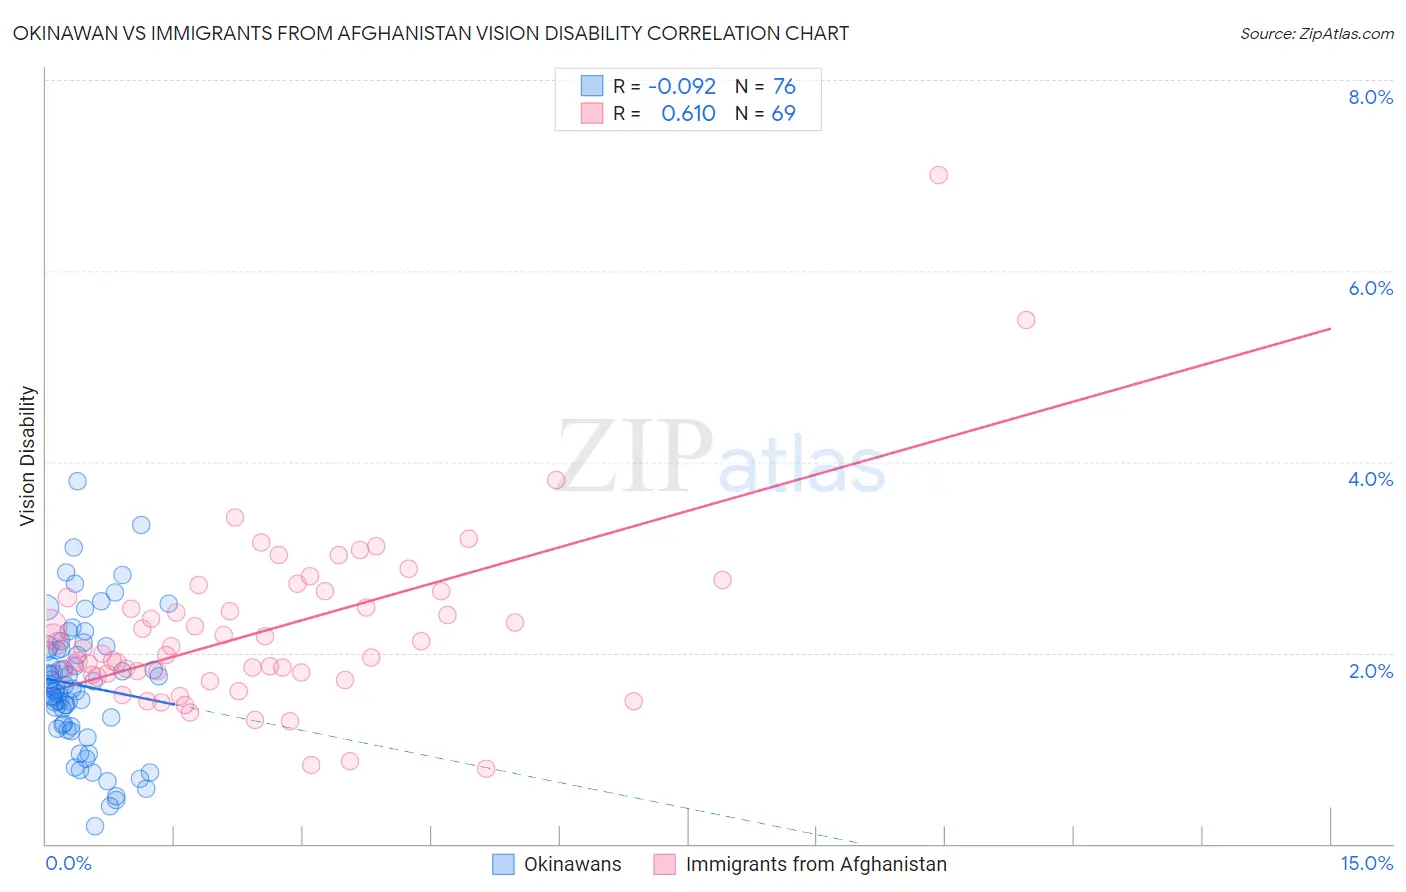
Okinawan vs Immigrants from Afghanistan Vision Disability Correlation Chart
The statistical analysis conducted on geographies consisting of 73,755,744 people shows a slight negative correlation between the proportion of Okinawans and percentage of population with vision disability in the United States with a correlation coefficient (R) of -0.092 and weighted average of 1.8%. Similarly, the statistical analysis conducted on geographies consisting of 147,616,042 people shows a significant positive correlation between the proportion of Immigrants from Afghanistan and percentage of population with vision disability in the United States with a correlation coefficient (R) of 0.610 and weighted average of 2.1%, a difference of 16.2%.
Vision Disability Correlation Summary
| Measurement | Okinawan | Immigrants from Afghanistan |
| Minimum | 0.19% | 0.79% |
| Maximum | 3.8% | 7.0% |
| Range | 3.6% | 6.2% |
| Mean | 1.7% | 2.2% |
| Median | 1.6% | 2.0% |
| Interquartile 25% (IQ1) | 1.2% | 1.8% |
| Interquartile 75% (IQ3) | 2.0% | 2.6% |
| Interquartile Range (IQR) | 0.80% | 0.84% |
| Standard Deviation (Sample) | 0.69% | 0.93% |
| Standard Deviation (Population) | 0.69% | 0.93% |
Similar Demographics by Vision Disability
Demographics Similar to Okinawans by Vision Disability
In terms of vision disability, the demographic groups most similar to Okinawans are Immigrants from Iran (1.8%, a difference of 0.59%), Immigrants from South Central Asia (1.8%, a difference of 0.65%), Iranian (1.8%, a difference of 0.80%), Immigrants from Singapore (1.8%, a difference of 1.5%), and Immigrants from Hong Kong (1.8%, a difference of 1.7%).
| Demographics | Rating | Rank | Vision Disability |
| Immigrants | India | 100.0 /100 | #1 | Exceptional 1.7% |
| Filipinos | 100.0 /100 | #2 | Exceptional 1.7% |
| Immigrants | Taiwan | 100.0 /100 | #3 | Exceptional 1.7% |
| Thais | 100.0 /100 | #4 | Exceptional 1.7% |
| Okinawans | 100.0 /100 | #5 | Exceptional 1.8% |
| Immigrants | Iran | 100.0 /100 | #6 | Exceptional 1.8% |
| Immigrants | South Central Asia | 100.0 /100 | #7 | Exceptional 1.8% |
| Iranians | 100.0 /100 | #8 | Exceptional 1.8% |
| Immigrants | Singapore | 100.0 /100 | #9 | Exceptional 1.8% |
| Immigrants | Hong Kong | 100.0 /100 | #10 | Exceptional 1.8% |
| Immigrants | Israel | 100.0 /100 | #11 | Exceptional 1.8% |
| Immigrants | Korea | 100.0 /100 | #12 | Exceptional 1.8% |
| Immigrants | Eastern Asia | 100.0 /100 | #13 | Exceptional 1.8% |
| Immigrants | China | 100.0 /100 | #14 | Exceptional 1.8% |
| Immigrants | Bolivia | 100.0 /100 | #15 | Exceptional 1.8% |
Demographics Similar to Immigrants from Afghanistan by Vision Disability
In terms of vision disability, the demographic groups most similar to Immigrants from Afghanistan are Immigrants from South Africa (2.1%, a difference of 0.050%), Romanian (2.1%, a difference of 0.070%), Estonian (2.1%, a difference of 0.12%), Australian (2.1%, a difference of 0.13%), and Greek (2.1%, a difference of 0.16%).
| Demographics | Rating | Rank | Vision Disability |
| Immigrants | Lebanon | 96.7 /100 | #90 | Exceptional 2.1% |
| Immigrants | Somalia | 96.2 /100 | #91 | Exceptional 2.1% |
| Immigrants | Syria | 96.2 /100 | #92 | Exceptional 2.1% |
| Immigrants | Europe | 96.1 /100 | #93 | Exceptional 2.1% |
| Immigrants | Croatia | 96.0 /100 | #94 | Exceptional 2.1% |
| Australians | 95.9 /100 | #95 | Exceptional 2.1% |
| Romanians | 95.7 /100 | #96 | Exceptional 2.1% |
| Immigrants | Afghanistan | 95.6 /100 | #97 | Exceptional 2.1% |
| Immigrants | South Africa | 95.4 /100 | #98 | Exceptional 2.1% |
| Estonians | 95.3 /100 | #99 | Exceptional 2.1% |
| Greeks | 95.1 /100 | #100 | Exceptional 2.1% |
| Albanians | 94.9 /100 | #101 | Exceptional 2.1% |
| Sri Lankans | 94.8 /100 | #102 | Exceptional 2.1% |
| Immigrants | Austria | 94.4 /100 | #103 | Exceptional 2.1% |
| Immigrants | Italy | 94.4 /100 | #104 | Exceptional 2.1% |