Latvian vs Immigrants from Afghanistan 7th Grade
COMPARE
Latvian
Immigrants from Afghanistan
7th Grade
7th Grade Comparison
Latvians
Immigrants from Afghanistan
97.2%
7TH GRADE
100.0/ 100
METRIC RATING
39th/ 347
METRIC RANK
95.1%
7TH GRADE
0.2/ 100
METRIC RATING
277th/ 347
METRIC RANK
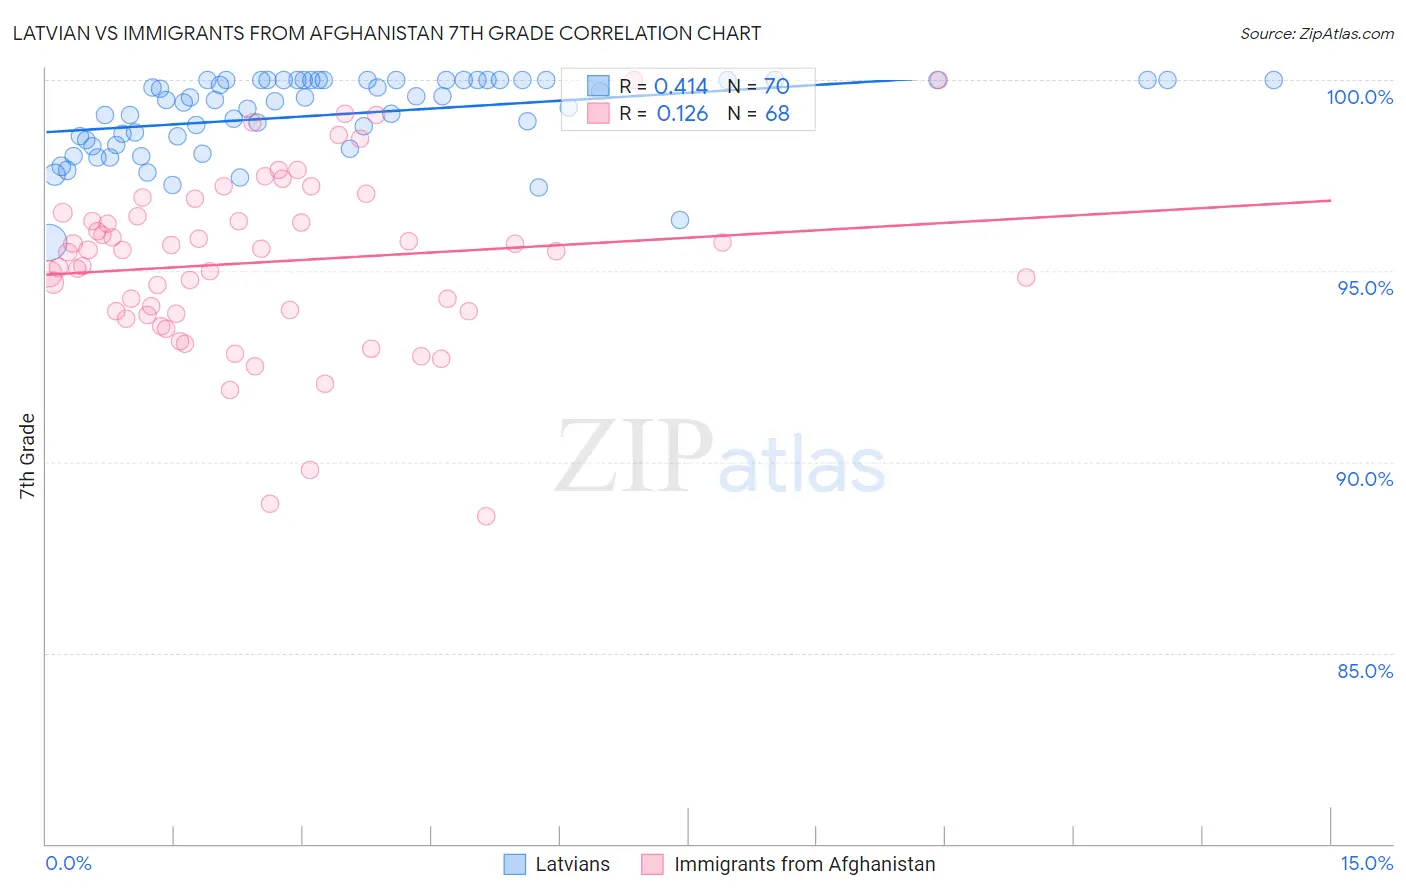
Latvian vs Immigrants from Afghanistan 7th Grade Correlation Chart
The statistical analysis conducted on geographies consisting of 220,726,452 people shows a moderate positive correlation between the proportion of Latvians and percentage of population with at least 7th grade education in the United States with a correlation coefficient (R) of 0.414 and weighted average of 97.2%. Similarly, the statistical analysis conducted on geographies consisting of 147,629,924 people shows a poor positive correlation between the proportion of Immigrants from Afghanistan and percentage of population with at least 7th grade education in the United States with a correlation coefficient (R) of 0.126 and weighted average of 95.1%, a difference of 2.2%.
7th Grade Correlation Summary
| Measurement | Latvian | Immigrants from Afghanistan |
| Minimum | 95.7% | 88.6% |
| Maximum | 100.0% | 100.0% |
| Range | 4.3% | 11.4% |
| Mean | 99.1% | 95.2% |
| Median | 99.5% | 95.5% |
| Interquartile 25% (IQ1) | 98.4% | 93.9% |
| Interquartile 75% (IQ3) | 100.0% | 96.5% |
| Interquartile Range (IQR) | 1.6% | 2.6% |
| Standard Deviation (Sample) | 1.0% | 2.3% |
| Standard Deviation (Population) | 1.0% | 2.3% |
Similar Demographics by 7th Grade
Demographics Similar to Latvians by 7th Grade
In terms of 7th grade, the demographic groups most similar to Latvians are Luxembourger (97.2%, a difference of 0.0%), Belgian (97.2%, a difference of 0.010%), British (97.2%, a difference of 0.020%), Eastern European (97.2%, a difference of 0.020%), and Hungarian (97.2%, a difference of 0.030%).
| Demographics | Rating | Rank | 7th Grade |
| Italians | 100.0 /100 | #32 | Exceptional 97.3% |
| Chippewa | 100.0 /100 | #33 | Exceptional 97.3% |
| Alaska Natives | 100.0 /100 | #34 | Exceptional 97.3% |
| Swiss | 100.0 /100 | #35 | Exceptional 97.3% |
| Hungarians | 100.0 /100 | #36 | Exceptional 97.2% |
| British | 100.0 /100 | #37 | Exceptional 97.2% |
| Belgians | 100.0 /100 | #38 | Exceptional 97.2% |
| Latvians | 100.0 /100 | #39 | Exceptional 97.2% |
| Luxembourgers | 100.0 /100 | #40 | Exceptional 97.2% |
| Eastern Europeans | 100.0 /100 | #41 | Exceptional 97.2% |
| Chinese | 99.9 /100 | #42 | Exceptional 97.1% |
| Maltese | 99.9 /100 | #43 | Exceptional 97.1% |
| Northern Europeans | 99.9 /100 | #44 | Exceptional 97.1% |
| Czechoslovakians | 99.9 /100 | #45 | Exceptional 97.1% |
| Aleuts | 99.9 /100 | #46 | Exceptional 97.1% |
Demographics Similar to Immigrants from Afghanistan by 7th Grade
In terms of 7th grade, the demographic groups most similar to Immigrants from Afghanistan are Immigrants from Thailand (95.1%, a difference of 0.020%), Immigrants from Trinidad and Tobago (95.1%, a difference of 0.030%), Immigrants from Colombia (95.1%, a difference of 0.040%), Barbadian (95.1%, a difference of 0.040%), and Immigrants from South America (95.1%, a difference of 0.050%).
| Demographics | Rating | Rank | 7th Grade |
| Houma | 0.2 /100 | #270 | Tragic 95.1% |
| Immigrants | South America | 0.2 /100 | #271 | Tragic 95.1% |
| Peruvians | 0.2 /100 | #272 | Tragic 95.1% |
| Immigrants | Uzbekistan | 0.2 /100 | #273 | Tragic 95.1% |
| Immigrants | Western Africa | 0.2 /100 | #274 | Tragic 95.1% |
| Immigrants | Colombia | 0.2 /100 | #275 | Tragic 95.1% |
| Immigrants | Thailand | 0.2 /100 | #276 | Tragic 95.1% |
| Immigrants | Afghanistan | 0.2 /100 | #277 | Tragic 95.1% |
| Immigrants | Trinidad and Tobago | 0.1 /100 | #278 | Tragic 95.1% |
| Barbadians | 0.1 /100 | #279 | Tragic 95.1% |
| Immigrants | St. Vincent and the Grenadines | 0.1 /100 | #280 | Tragic 95.0% |
| Tohono O'odham | 0.1 /100 | #281 | Tragic 95.0% |
| Immigrants | Bolivia | 0.1 /100 | #282 | Tragic 95.0% |
| Immigrants | Barbados | 0.1 /100 | #283 | Tragic 95.0% |
| Armenians | 0.1 /100 | #284 | Tragic 95.0% |