Immigrants from Western Europe vs Delaware Vision Disability
COMPARE
Immigrants from Western Europe
Delaware
Vision Disability
Vision Disability Comparison
Immigrants from Western Europe
Delaware
2.2%
VISION DISABILITY
41.1/ 100
METRIC RATING
181st/ 347
METRIC RANK
2.5%
VISION DISABILITY
0.0/ 100
METRIC RATING
295th/ 347
METRIC RANK
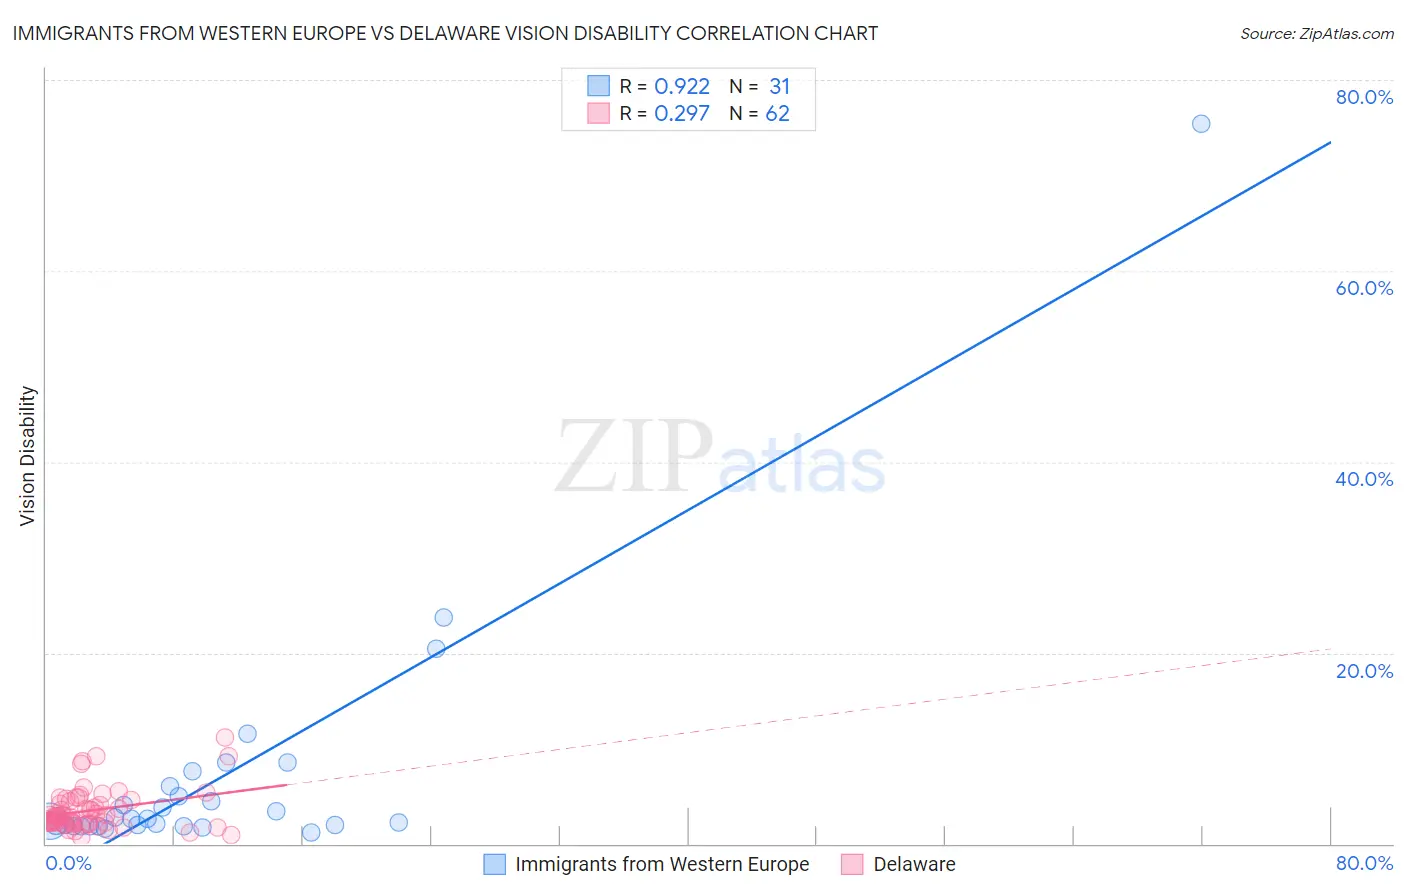
Immigrants from Western Europe vs Delaware Vision Disability Correlation Chart
The statistical analysis conducted on geographies consisting of 493,396,041 people shows a near-perfect positive correlation between the proportion of Immigrants from Western Europe and percentage of population with vision disability in the United States with a correlation coefficient (R) of 0.922 and weighted average of 2.2%. Similarly, the statistical analysis conducted on geographies consisting of 96,219,222 people shows a weak positive correlation between the proportion of Delaware and percentage of population with vision disability in the United States with a correlation coefficient (R) of 0.297 and weighted average of 2.5%, a difference of 15.2%.
Vision Disability Correlation Summary
| Measurement | Immigrants from Western Europe | Delaware |
| Minimum | 1.2% | 0.66% |
| Maximum | 75.4% | 11.1% |
| Range | 74.2% | 10.5% |
| Mean | 7.0% | 3.5% |
| Median | 2.6% | 2.9% |
| Interquartile 25% (IQ1) | 1.9% | 2.2% |
| Interquartile 75% (IQ3) | 6.1% | 4.5% |
| Interquartile Range (IQR) | 4.2% | 2.3% |
| Standard Deviation (Sample) | 13.7% | 2.1% |
| Standard Deviation (Population) | 13.5% | 2.1% |
Similar Demographics by Vision Disability
Demographics Similar to Immigrants from Western Europe by Vision Disability
In terms of vision disability, the demographic groups most similar to Immigrants from Western Europe are Costa Rican (2.2%, a difference of 0.020%), Uruguayan (2.2%, a difference of 0.10%), Immigrants from Burma/Myanmar (2.2%, a difference of 0.21%), Immigrants from North America (2.2%, a difference of 0.22%), and Immigrants from Oceania (2.2%, a difference of 0.26%).
| Demographics | Rating | Rank | Vision Disability |
| Immigrants | Canada | 50.0 /100 | #174 | Average 2.2% |
| Immigrants | Fiji | 47.6 /100 | #175 | Average 2.2% |
| Yugoslavians | 46.5 /100 | #176 | Average 2.2% |
| Slavs | 46.0 /100 | #177 | Average 2.2% |
| Immigrants | Oceania | 45.1 /100 | #178 | Average 2.2% |
| Immigrants | North America | 44.5 /100 | #179 | Average 2.2% |
| Uruguayans | 42.7 /100 | #180 | Average 2.2% |
| Immigrants | Western Europe | 41.1 /100 | #181 | Average 2.2% |
| Costa Ricans | 40.7 /100 | #182 | Average 2.2% |
| Immigrants | Burma/Myanmar | 37.9 /100 | #183 | Fair 2.2% |
| Moroccans | 35.4 /100 | #184 | Fair 2.2% |
| Immigrants | Middle Africa | 33.5 /100 | #185 | Fair 2.2% |
| Native Hawaiians | 33.3 /100 | #186 | Fair 2.2% |
| Immigrants | St. Vincent and the Grenadines | 30.3 /100 | #187 | Fair 2.2% |
| Guyanese | 28.9 /100 | #188 | Fair 2.2% |
Demographics Similar to Delaware by Vision Disability
In terms of vision disability, the demographic groups most similar to Delaware are Immigrants from Mexico (2.5%, a difference of 0.11%), Ottawa (2.5%, a difference of 0.21%), Yaqui (2.5%, a difference of 0.55%), Crow (2.5%, a difference of 0.58%), and Immigrants from Honduras (2.5%, a difference of 0.67%).
| Demographics | Rating | Rank | Vision Disability |
| French American Indians | 0.0 /100 | #288 | Tragic 2.5% |
| Immigrants | Nonimmigrants | 0.0 /100 | #289 | Tragic 2.5% |
| Immigrants | Cuba | 0.0 /100 | #290 | Tragic 2.5% |
| Immigrants | Honduras | 0.0 /100 | #291 | Tragic 2.5% |
| Crow | 0.0 /100 | #292 | Tragic 2.5% |
| Yaqui | 0.0 /100 | #293 | Tragic 2.5% |
| Ottawa | 0.0 /100 | #294 | Tragic 2.5% |
| Delaware | 0.0 /100 | #295 | Tragic 2.5% |
| Immigrants | Mexico | 0.0 /100 | #296 | Tragic 2.5% |
| Immigrants | Dominica | 0.0 /100 | #297 | Tragic 2.5% |
| Mexicans | 0.0 /100 | #298 | Tragic 2.5% |
| Cree | 0.0 /100 | #299 | Tragic 2.5% |
| Africans | 0.0 /100 | #300 | Tragic 2.5% |
| Menominee | 0.0 /100 | #301 | Tragic 2.5% |
| Spanish American Indians | 0.0 /100 | #302 | Tragic 2.6% |