Filipino vs Delaware Vision Disability
COMPARE
Filipino
Delaware
Vision Disability
Vision Disability Comparison
Filipinos
Delaware
1.7%
VISION DISABILITY
100.0/ 100
METRIC RATING
2nd/ 347
METRIC RANK
2.5%
VISION DISABILITY
0.0/ 100
METRIC RATING
295th/ 347
METRIC RANK
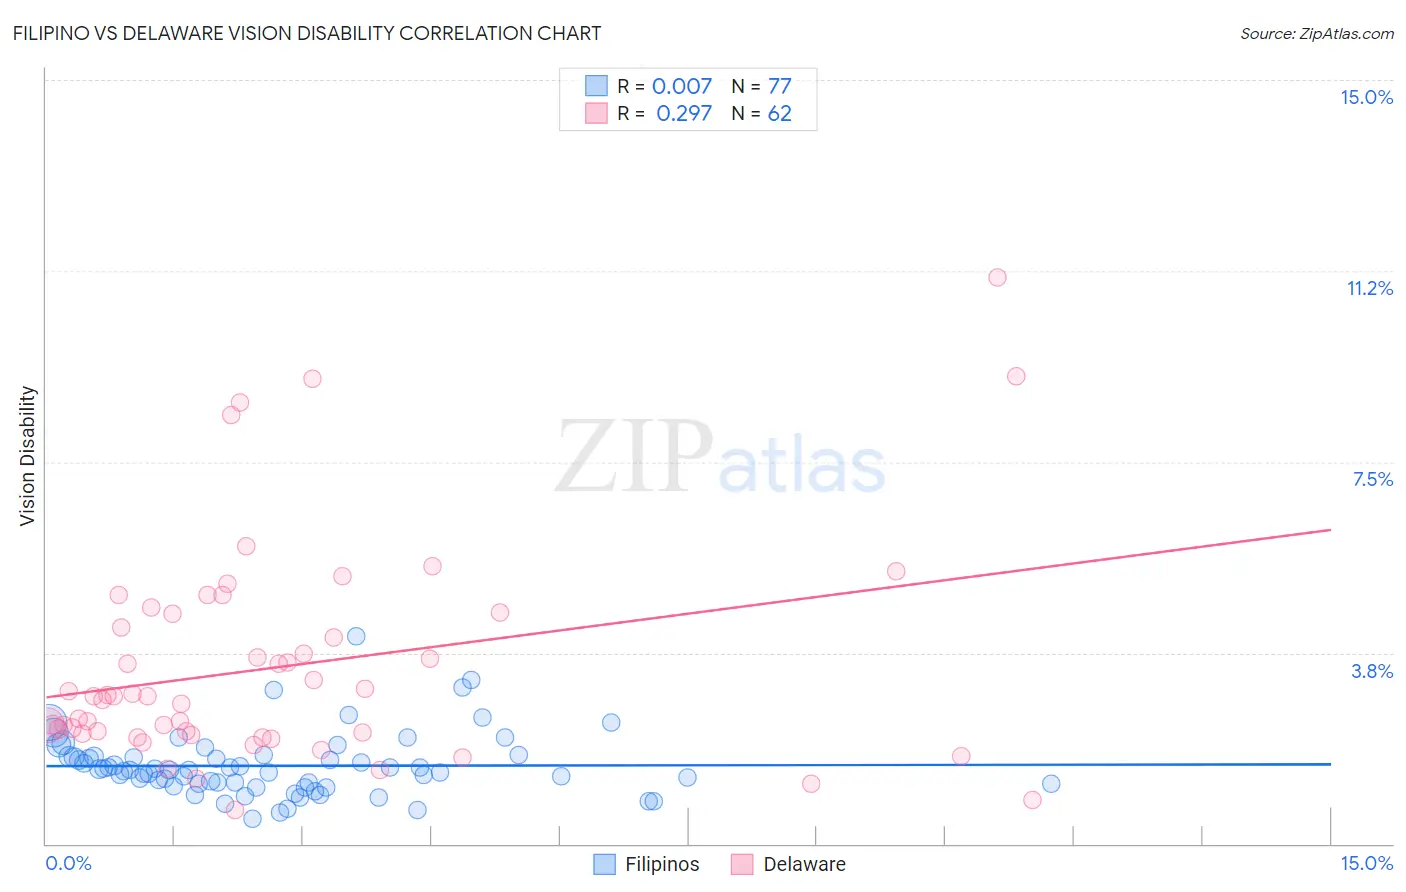
Filipino vs Delaware Vision Disability Correlation Chart
The statistical analysis conducted on geographies consisting of 254,226,053 people shows no correlation between the proportion of Filipinos and percentage of population with vision disability in the United States with a correlation coefficient (R) of 0.007 and weighted average of 1.7%. Similarly, the statistical analysis conducted on geographies consisting of 96,219,222 people shows a weak positive correlation between the proportion of Delaware and percentage of population with vision disability in the United States with a correlation coefficient (R) of 0.297 and weighted average of 2.5%, a difference of 48.9%.
Vision Disability Correlation Summary
| Measurement | Filipino | Delaware |
| Minimum | 0.48% | 0.66% |
| Maximum | 4.1% | 11.1% |
| Range | 3.6% | 10.5% |
| Mean | 1.5% | 3.5% |
| Median | 1.4% | 2.9% |
| Interquartile 25% (IQ1) | 1.2% | 2.2% |
| Interquartile 75% (IQ3) | 1.7% | 4.5% |
| Interquartile Range (IQR) | 0.53% | 2.3% |
| Standard Deviation (Sample) | 0.61% | 2.1% |
| Standard Deviation (Population) | 0.61% | 2.1% |
Similar Demographics by Vision Disability
Demographics Similar to Filipinos by Vision Disability
In terms of vision disability, the demographic groups most similar to Filipinos are Immigrants from India (1.7%, a difference of 0.050%), Immigrants from Taiwan (1.7%, a difference of 0.65%), Thai (1.7%, a difference of 3.3%), Okinawan (1.8%, a difference of 5.3%), and Immigrants from Iran (1.8%, a difference of 5.9%).
| Demographics | Rating | Rank | Vision Disability |
| Immigrants | India | 100.0 /100 | #1 | Exceptional 1.7% |
| Filipinos | 100.0 /100 | #2 | Exceptional 1.7% |
| Immigrants | Taiwan | 100.0 /100 | #3 | Exceptional 1.7% |
| Thais | 100.0 /100 | #4 | Exceptional 1.7% |
| Okinawans | 100.0 /100 | #5 | Exceptional 1.8% |
| Immigrants | Iran | 100.0 /100 | #6 | Exceptional 1.8% |
| Immigrants | South Central Asia | 100.0 /100 | #7 | Exceptional 1.8% |
| Iranians | 100.0 /100 | #8 | Exceptional 1.8% |
| Immigrants | Singapore | 100.0 /100 | #9 | Exceptional 1.8% |
| Immigrants | Hong Kong | 100.0 /100 | #10 | Exceptional 1.8% |
| Immigrants | Israel | 100.0 /100 | #11 | Exceptional 1.8% |
| Immigrants | Korea | 100.0 /100 | #12 | Exceptional 1.8% |
| Immigrants | Eastern Asia | 100.0 /100 | #13 | Exceptional 1.8% |
| Immigrants | China | 100.0 /100 | #14 | Exceptional 1.8% |
| Immigrants | Bolivia | 100.0 /100 | #15 | Exceptional 1.8% |
Demographics Similar to Delaware by Vision Disability
In terms of vision disability, the demographic groups most similar to Delaware are Immigrants from Mexico (2.5%, a difference of 0.11%), Ottawa (2.5%, a difference of 0.21%), Yaqui (2.5%, a difference of 0.55%), Crow (2.5%, a difference of 0.58%), and Immigrants from Honduras (2.5%, a difference of 0.67%).
| Demographics | Rating | Rank | Vision Disability |
| French American Indians | 0.0 /100 | #288 | Tragic 2.5% |
| Immigrants | Nonimmigrants | 0.0 /100 | #289 | Tragic 2.5% |
| Immigrants | Cuba | 0.0 /100 | #290 | Tragic 2.5% |
| Immigrants | Honduras | 0.0 /100 | #291 | Tragic 2.5% |
| Crow | 0.0 /100 | #292 | Tragic 2.5% |
| Yaqui | 0.0 /100 | #293 | Tragic 2.5% |
| Ottawa | 0.0 /100 | #294 | Tragic 2.5% |
| Delaware | 0.0 /100 | #295 | Tragic 2.5% |
| Immigrants | Mexico | 0.0 /100 | #296 | Tragic 2.5% |
| Immigrants | Dominica | 0.0 /100 | #297 | Tragic 2.5% |
| Mexicans | 0.0 /100 | #298 | Tragic 2.5% |
| Cree | 0.0 /100 | #299 | Tragic 2.5% |
| Africans | 0.0 /100 | #300 | Tragic 2.5% |
| Menominee | 0.0 /100 | #301 | Tragic 2.5% |
| Spanish American Indians | 0.0 /100 | #302 | Tragic 2.6% |