Immigrants from Mexico vs Delaware Vision Disability
COMPARE
Immigrants from Mexico
Delaware
Vision Disability
Vision Disability Comparison
Immigrants from Mexico
Delaware
2.5%
VISION DISABILITY
0.0/ 100
METRIC RATING
296th/ 347
METRIC RANK
2.5%
VISION DISABILITY
0.0/ 100
METRIC RATING
295th/ 347
METRIC RANK
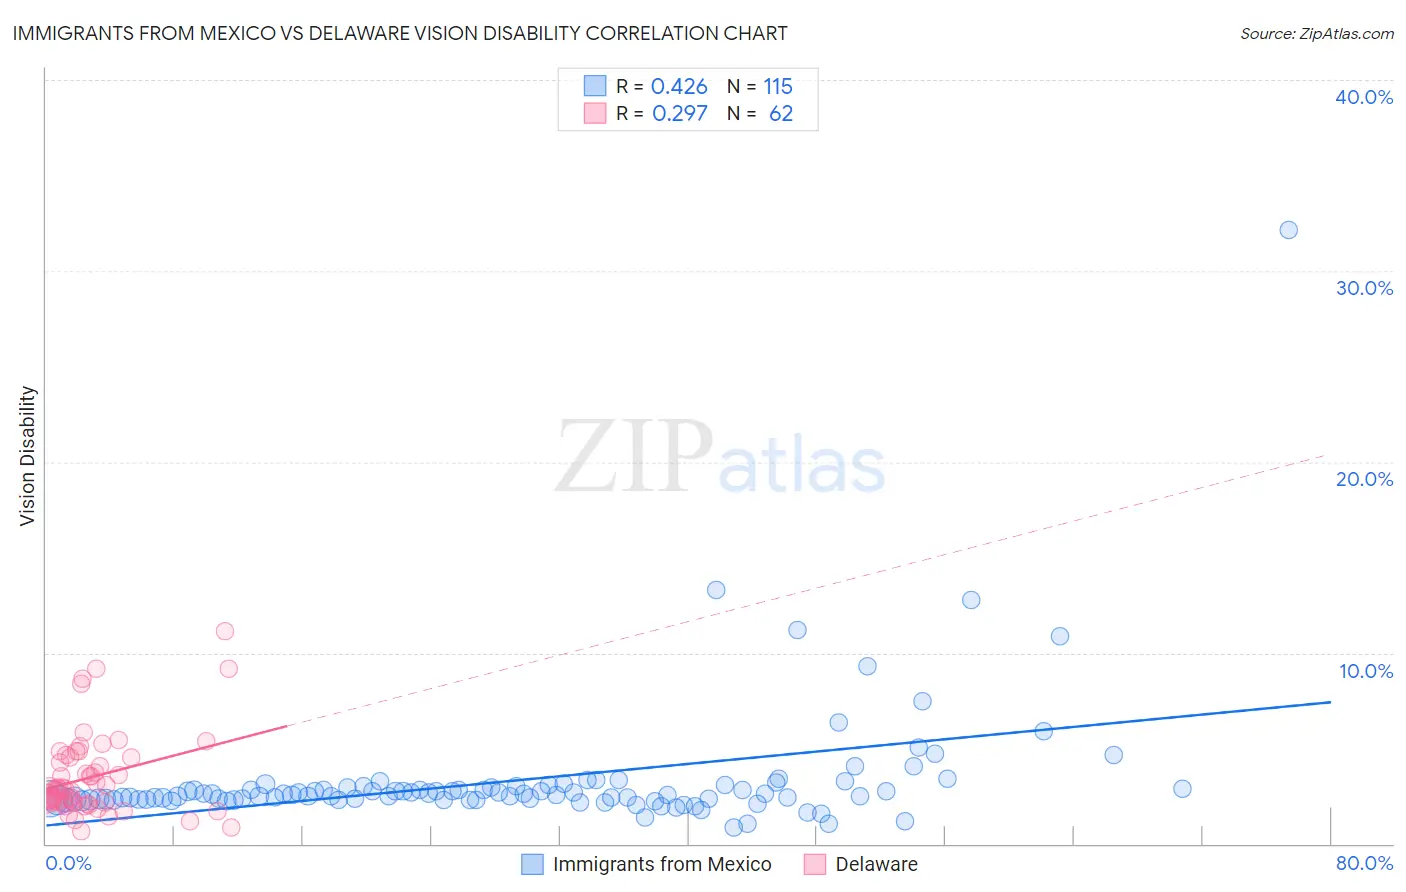
Immigrants from Mexico vs Delaware Vision Disability Correlation Chart
The statistical analysis conducted on geographies consisting of 512,775,331 people shows a moderate positive correlation between the proportion of Immigrants from Mexico and percentage of population with vision disability in the United States with a correlation coefficient (R) of 0.426 and weighted average of 2.5%. Similarly, the statistical analysis conducted on geographies consisting of 96,219,222 people shows a weak positive correlation between the proportion of Delaware and percentage of population with vision disability in the United States with a correlation coefficient (R) of 0.297 and weighted average of 2.5%, a difference of 0.11%.
Vision Disability Correlation Summary
| Measurement | Immigrants from Mexico | Delaware |
| Minimum | 0.88% | 0.66% |
| Maximum | 32.1% | 11.1% |
| Range | 31.3% | 10.5% |
| Mean | 3.3% | 3.5% |
| Median | 2.6% | 2.9% |
| Interquartile 25% (IQ1) | 2.3% | 2.2% |
| Interquartile 75% (IQ3) | 3.0% | 4.5% |
| Interquartile Range (IQR) | 0.66% | 2.3% |
| Standard Deviation (Sample) | 3.4% | 2.1% |
| Standard Deviation (Population) | 3.4% | 2.1% |
Demographics Similar to Immigrants from Mexico and Delaware by Vision Disability
In terms of vision disability, the demographic groups most similar to Immigrants from Mexico are Ottawa (2.5%, a difference of 0.32%), Yaqui (2.5%, a difference of 0.66%), Crow (2.5%, a difference of 0.68%), Immigrants from Dominica (2.5%, a difference of 0.68%), and Immigrants from Honduras (2.5%, a difference of 0.78%). Similarly, the demographic groups most similar to Delaware are Ottawa (2.5%, a difference of 0.21%), Yaqui (2.5%, a difference of 0.55%), Crow (2.5%, a difference of 0.58%), Immigrants from Honduras (2.5%, a difference of 0.67%), and Immigrants from Dominica (2.5%, a difference of 0.79%).
| Demographics | Rating | Rank | Vision Disability |
| Immigrants | Central America | 0.0 /100 | #285 | Tragic 2.5% |
| Sioux | 0.0 /100 | #286 | Tragic 2.5% |
| Hondurans | 0.0 /100 | #287 | Tragic 2.5% |
| French American Indians | 0.0 /100 | #288 | Tragic 2.5% |
| Immigrants | Nonimmigrants | 0.0 /100 | #289 | Tragic 2.5% |
| Immigrants | Cuba | 0.0 /100 | #290 | Tragic 2.5% |
| Immigrants | Honduras | 0.0 /100 | #291 | Tragic 2.5% |
| Crow | 0.0 /100 | #292 | Tragic 2.5% |
| Yaqui | 0.0 /100 | #293 | Tragic 2.5% |
| Ottawa | 0.0 /100 | #294 | Tragic 2.5% |
| Delaware | 0.0 /100 | #295 | Tragic 2.5% |
| Immigrants | Mexico | 0.0 /100 | #296 | Tragic 2.5% |
| Immigrants | Dominica | 0.0 /100 | #297 | Tragic 2.5% |
| Mexicans | 0.0 /100 | #298 | Tragic 2.5% |
| Cree | 0.0 /100 | #299 | Tragic 2.5% |
| Africans | 0.0 /100 | #300 | Tragic 2.5% |
| Menominee | 0.0 /100 | #301 | Tragic 2.5% |
| Spanish American Indians | 0.0 /100 | #302 | Tragic 2.6% |
| Immigrants | Cabo Verde | 0.0 /100 | #303 | Tragic 2.6% |
| Aleuts | 0.0 /100 | #304 | Tragic 2.6% |
| Hispanics or Latinos | 0.0 /100 | #305 | Tragic 2.6% |