Laotian vs Immigrants from Sudan Disability
COMPARE
Laotian
Immigrants from Sudan
Disability
Disability Comparison
Laotians
Immigrants from Sudan
11.0%
DISABILITY
99.6/ 100
METRIC RATING
66th/ 347
METRIC RANK
11.5%
DISABILITY
85.3/ 100
METRIC RATING
142nd/ 347
METRIC RANK
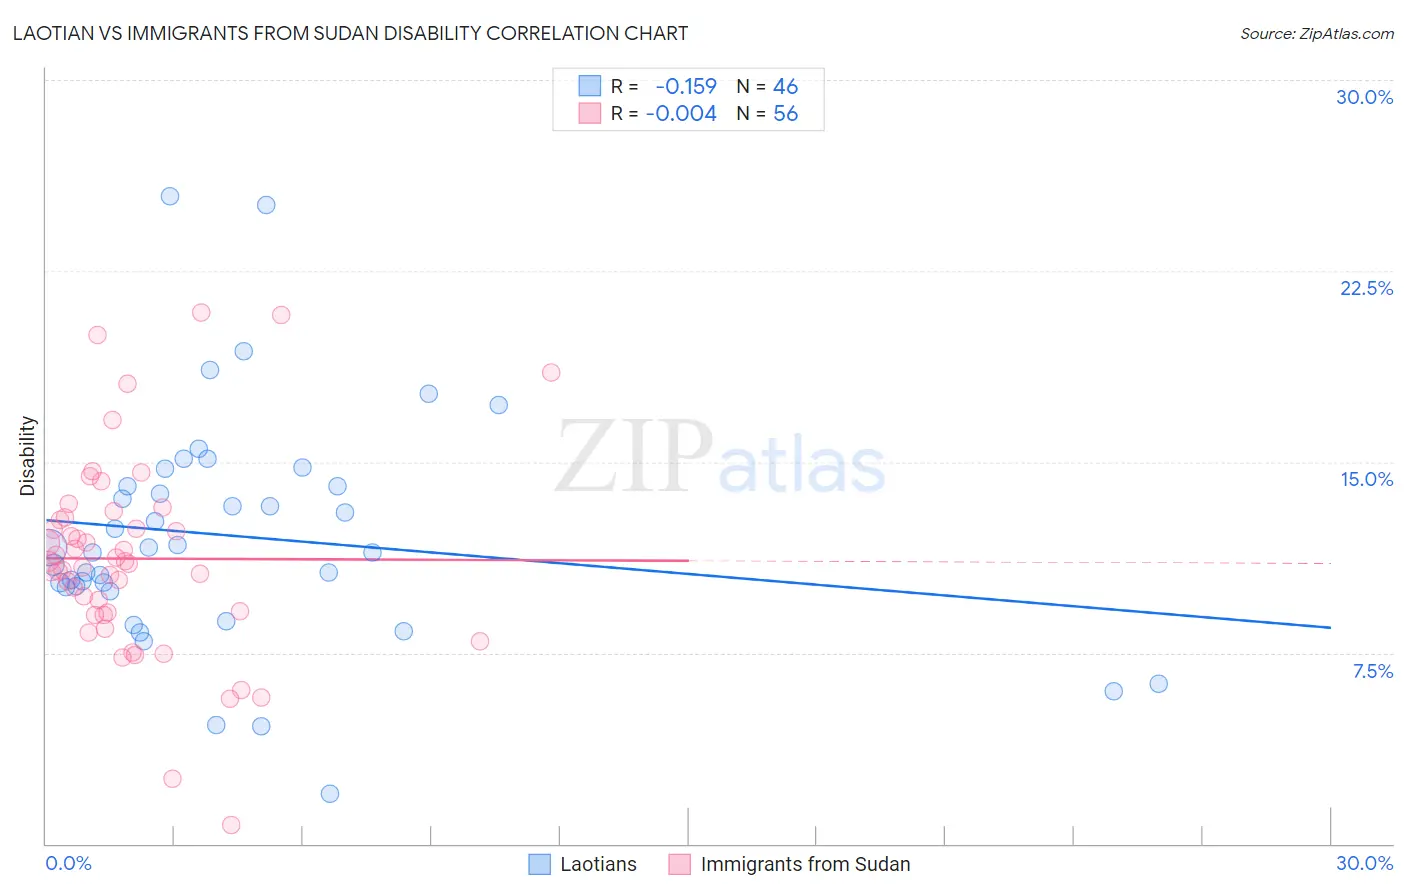
Laotian vs Immigrants from Sudan Disability Correlation Chart
The statistical analysis conducted on geographies consisting of 224,855,806 people shows a poor negative correlation between the proportion of Laotians and percentage of population with a disability in the United States with a correlation coefficient (R) of -0.159 and weighted average of 11.0%. Similarly, the statistical analysis conducted on geographies consisting of 118,962,854 people shows no correlation between the proportion of Immigrants from Sudan and percentage of population with a disability in the United States with a correlation coefficient (R) of -0.004 and weighted average of 11.5%, a difference of 4.5%.
Disability Correlation Summary
| Measurement | Laotian | Immigrants from Sudan |
| Minimum | 2.0% | 0.75% |
| Maximum | 25.4% | 20.9% |
| Range | 23.5% | 20.1% |
| Mean | 12.1% | 11.2% |
| Median | 11.6% | 11.0% |
| Interquartile 25% (IQ1) | 10.1% | 9.0% |
| Interquartile 75% (IQ3) | 14.1% | 12.8% |
| Interquartile Range (IQR) | 4.0% | 3.8% |
| Standard Deviation (Sample) | 4.6% | 3.9% |
| Standard Deviation (Population) | 4.5% | 3.9% |
Similar Demographics by Disability
Demographics Similar to Laotians by Disability
In terms of disability, the demographic groups most similar to Laotians are Bulgarian (11.0%, a difference of 0.010%), Immigrants from Sweden (11.0%, a difference of 0.030%), Colombian (11.0%, a difference of 0.080%), Immigrants from Afghanistan (11.0%, a difference of 0.20%), and Immigrants from Eritrea (11.0%, a difference of 0.21%).
| Demographics | Rating | Rank | Disability |
| Immigrants | Colombia | 99.7 /100 | #59 | Exceptional 10.9% |
| Zimbabweans | 99.7 /100 | #60 | Exceptional 10.9% |
| Immigrants | Bulgaria | 99.7 /100 | #61 | Exceptional 10.9% |
| Immigrants | Northern Africa | 99.7 /100 | #62 | Exceptional 10.9% |
| Immigrants | Eritrea | 99.7 /100 | #63 | Exceptional 11.0% |
| Immigrants | Sweden | 99.6 /100 | #64 | Exceptional 11.0% |
| Bulgarians | 99.6 /100 | #65 | Exceptional 11.0% |
| Laotians | 99.6 /100 | #66 | Exceptional 11.0% |
| Colombians | 99.6 /100 | #67 | Exceptional 11.0% |
| Immigrants | Afghanistan | 99.6 /100 | #68 | Exceptional 11.0% |
| Sri Lankans | 99.5 /100 | #69 | Exceptional 11.0% |
| Immigrants | France | 99.4 /100 | #70 | Exceptional 11.0% |
| Immigrants | Lebanon | 99.4 /100 | #71 | Exceptional 11.0% |
| Immigrants | Chile | 99.4 /100 | #72 | Exceptional 11.0% |
| Immigrants | Bangladesh | 99.4 /100 | #73 | Exceptional 11.0% |
Demographics Similar to Immigrants from Sudan by Disability
In terms of disability, the demographic groups most similar to Immigrants from Sudan are Immigrants from Grenada (11.5%, a difference of 0.070%), Russian (11.5%, a difference of 0.14%), New Zealander (11.5%, a difference of 0.16%), Ghanaian (11.5%, a difference of 0.16%), and Kenyan (11.5%, a difference of 0.17%).
| Demographics | Rating | Rank | Disability |
| Ugandans | 87.9 /100 | #135 | Excellent 11.4% |
| Immigrants | St. Vincent and the Grenadines | 87.8 /100 | #136 | Excellent 11.4% |
| Kenyans | 87.1 /100 | #137 | Excellent 11.5% |
| New Zealanders | 87.0 /100 | #138 | Excellent 11.5% |
| Ghanaians | 87.0 /100 | #139 | Excellent 11.5% |
| Russians | 86.8 /100 | #140 | Excellent 11.5% |
| Immigrants | Grenada | 86.1 /100 | #141 | Excellent 11.5% |
| Immigrants | Sudan | 85.3 /100 | #142 | Excellent 11.5% |
| Moroccans | 83.3 /100 | #143 | Excellent 11.5% |
| Australians | 82.5 /100 | #144 | Excellent 11.5% |
| Nigerians | 81.3 /100 | #145 | Excellent 11.5% |
| Immigrants | Hungary | 79.0 /100 | #146 | Good 11.5% |
| Immigrants | Ukraine | 77.6 /100 | #147 | Good 11.5% |
| Sudanese | 77.1 /100 | #148 | Good 11.5% |
| Immigrants | Norway | 73.2 /100 | #149 | Good 11.6% |