Nicaraguan vs Immigrants from Sudan Disability
COMPARE
Nicaraguan
Immigrants from Sudan
Disability
Disability Comparison
Nicaraguans
Immigrants from Sudan
11.3%
DISABILITY
96.2/ 100
METRIC RATING
107th/ 347
METRIC RANK
11.5%
DISABILITY
85.3/ 100
METRIC RATING
142nd/ 347
METRIC RANK
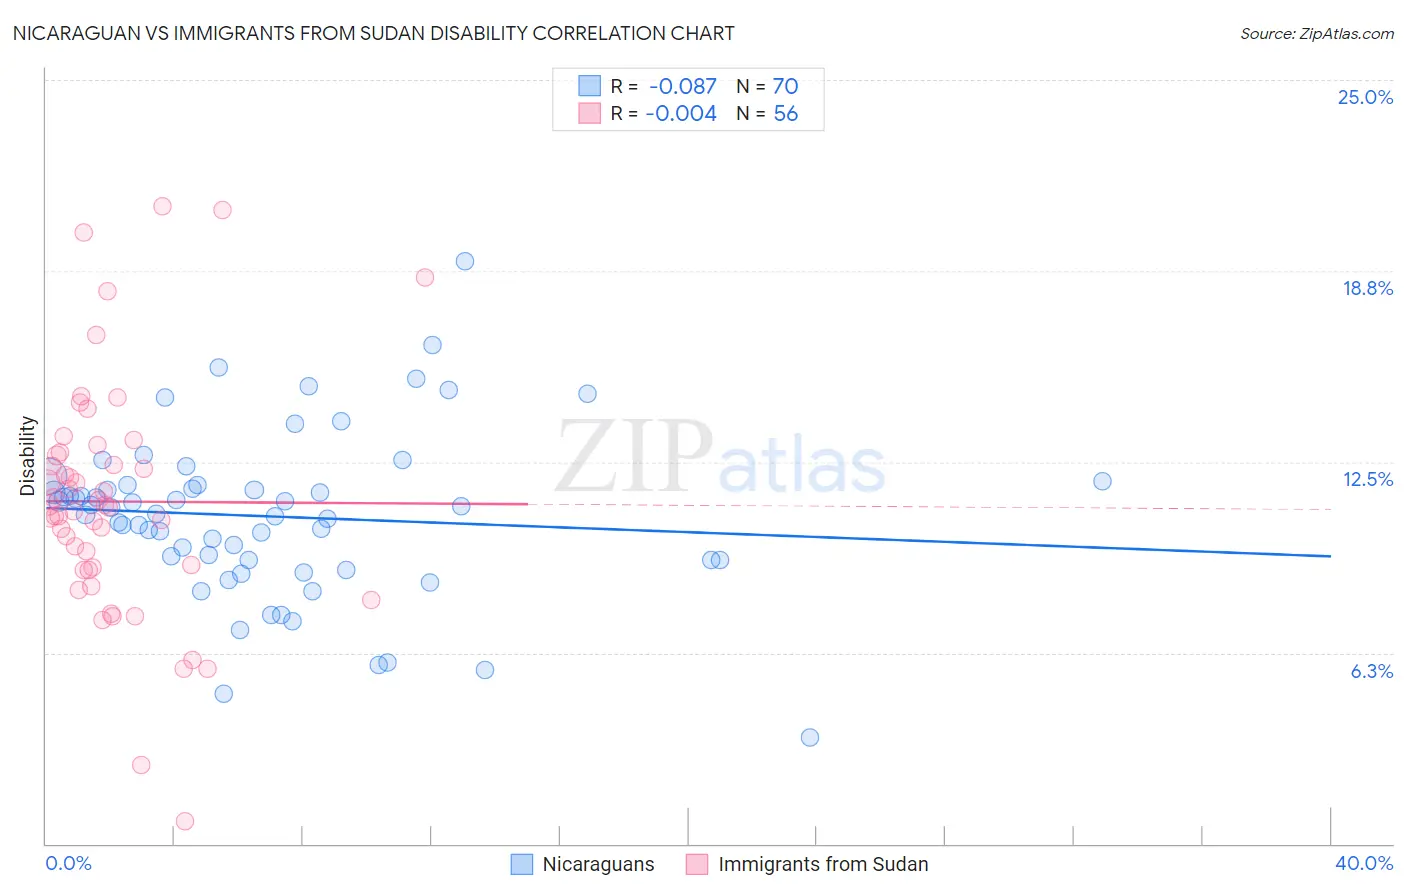
Nicaraguan vs Immigrants from Sudan Disability Correlation Chart
The statistical analysis conducted on geographies consisting of 285,692,565 people shows a slight negative correlation between the proportion of Nicaraguans and percentage of population with a disability in the United States with a correlation coefficient (R) of -0.087 and weighted average of 11.3%. Similarly, the statistical analysis conducted on geographies consisting of 118,962,854 people shows no correlation between the proportion of Immigrants from Sudan and percentage of population with a disability in the United States with a correlation coefficient (R) of -0.004 and weighted average of 11.5%, a difference of 1.7%.
Disability Correlation Summary
| Measurement | Nicaraguan | Immigrants from Sudan |
| Minimum | 3.5% | 0.75% |
| Maximum | 19.0% | 20.9% |
| Range | 15.6% | 20.1% |
| Mean | 10.7% | 11.2% |
| Median | 10.9% | 11.0% |
| Interquartile 25% (IQ1) | 9.3% | 9.0% |
| Interquartile 75% (IQ3) | 11.7% | 12.8% |
| Interquartile Range (IQR) | 2.5% | 3.8% |
| Standard Deviation (Sample) | 2.7% | 3.9% |
| Standard Deviation (Population) | 2.7% | 3.9% |
Similar Demographics by Disability
Demographics Similar to Nicaraguans by Disability
In terms of disability, the demographic groups most similar to Nicaraguans are Immigrants from Eastern Europe (11.3%, a difference of 0.020%), Immigrants from Kazakhstan (11.3%, a difference of 0.050%), Immigrants from Uruguay (11.3%, a difference of 0.060%), Immigrants (11.3%, a difference of 0.060%), and Immigrants from Nigeria (11.3%, a difference of 0.080%).
| Demographics | Rating | Rank | Disability |
| Immigrants | Greece | 96.9 /100 | #100 | Exceptional 11.3% |
| Immigrants | Nicaragua | 96.8 /100 | #101 | Exceptional 11.3% |
| Immigrants | Eastern Africa | 96.7 /100 | #102 | Exceptional 11.3% |
| Immigrants | Uruguay | 96.4 /100 | #103 | Exceptional 11.3% |
| Immigrants | Immigrants | 96.4 /100 | #104 | Exceptional 11.3% |
| Immigrants | Kazakhstan | 96.4 /100 | #105 | Exceptional 11.3% |
| Immigrants | Eastern Europe | 96.3 /100 | #106 | Exceptional 11.3% |
| Nicaraguans | 96.2 /100 | #107 | Exceptional 11.3% |
| Immigrants | Nigeria | 96.0 /100 | #108 | Exceptional 11.3% |
| Immigrants | Uganda | 95.7 /100 | #109 | Exceptional 11.3% |
| Immigrants | Denmark | 95.6 /100 | #110 | Exceptional 11.3% |
| Immigrants | South Eastern Asia | 95.4 /100 | #111 | Exceptional 11.3% |
| Immigrants | Uzbekistan | 94.9 /100 | #112 | Exceptional 11.3% |
| Guyanese | 94.7 /100 | #113 | Exceptional 11.3% |
| Immigrants | Syria | 94.7 /100 | #114 | Exceptional 11.3% |
Demographics Similar to Immigrants from Sudan by Disability
In terms of disability, the demographic groups most similar to Immigrants from Sudan are Immigrants from Grenada (11.5%, a difference of 0.070%), Russian (11.5%, a difference of 0.14%), New Zealander (11.5%, a difference of 0.16%), Ghanaian (11.5%, a difference of 0.16%), and Kenyan (11.5%, a difference of 0.17%).
| Demographics | Rating | Rank | Disability |
| Ugandans | 87.9 /100 | #135 | Excellent 11.4% |
| Immigrants | St. Vincent and the Grenadines | 87.8 /100 | #136 | Excellent 11.4% |
| Kenyans | 87.1 /100 | #137 | Excellent 11.5% |
| New Zealanders | 87.0 /100 | #138 | Excellent 11.5% |
| Ghanaians | 87.0 /100 | #139 | Excellent 11.5% |
| Russians | 86.8 /100 | #140 | Excellent 11.5% |
| Immigrants | Grenada | 86.1 /100 | #141 | Excellent 11.5% |
| Immigrants | Sudan | 85.3 /100 | #142 | Excellent 11.5% |
| Moroccans | 83.3 /100 | #143 | Excellent 11.5% |
| Australians | 82.5 /100 | #144 | Excellent 11.5% |
| Nigerians | 81.3 /100 | #145 | Excellent 11.5% |
| Immigrants | Hungary | 79.0 /100 | #146 | Good 11.5% |
| Immigrants | Ukraine | 77.6 /100 | #147 | Good 11.5% |
| Sudanese | 77.1 /100 | #148 | Good 11.5% |
| Immigrants | Norway | 73.2 /100 | #149 | Good 11.6% |