Laotian vs Ugandan Disability
COMPARE
Laotian
Ugandan
Disability
Disability Comparison
Laotians
Ugandans
11.0%
DISABILITY
99.6/ 100
METRIC RATING
66th/ 347
METRIC RANK
11.4%
DISABILITY
87.9/ 100
METRIC RATING
135th/ 347
METRIC RANK
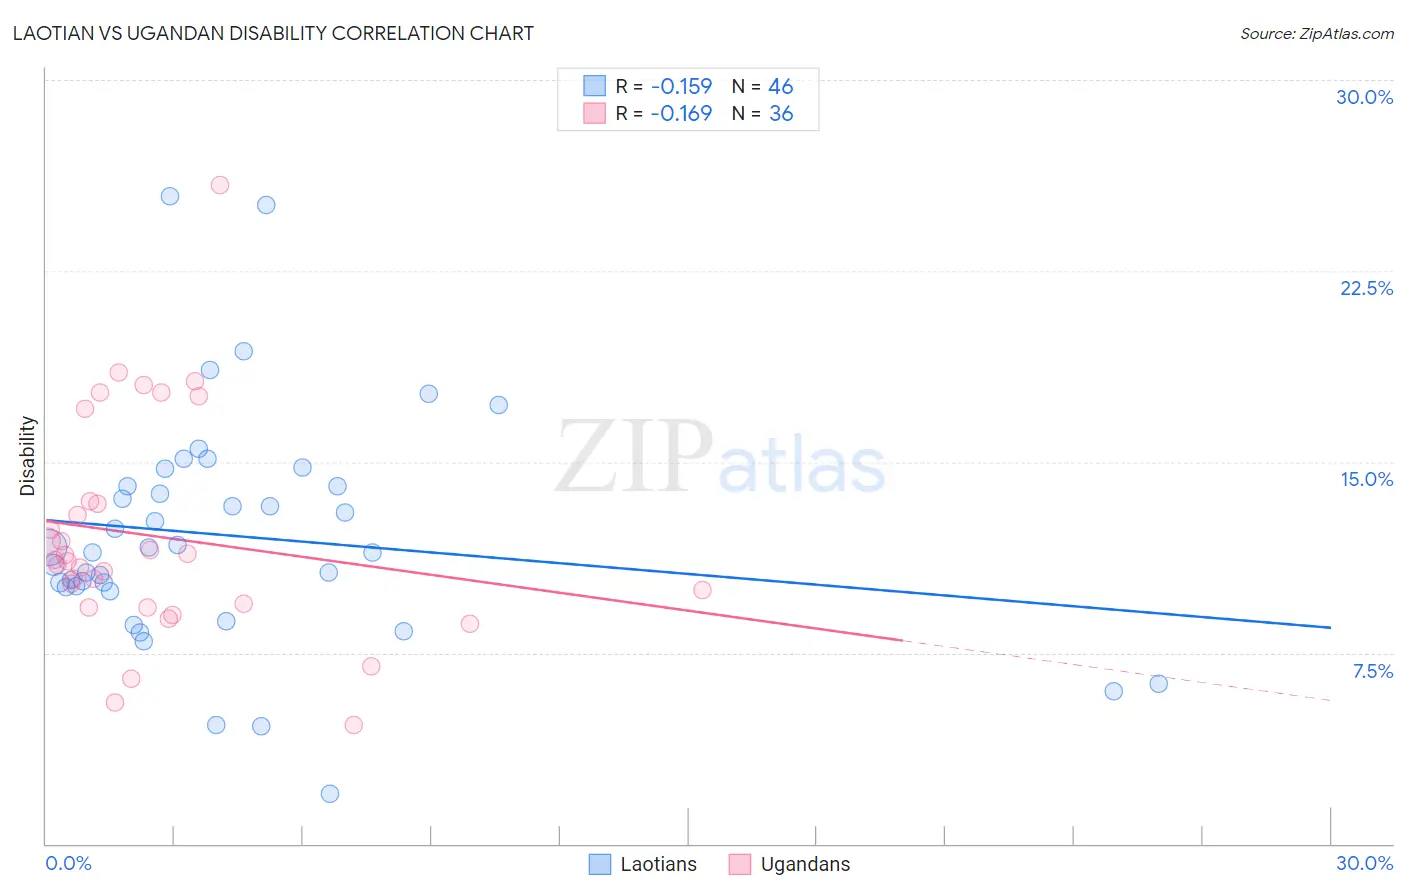
Laotian vs Ugandan Disability Correlation Chart
The statistical analysis conducted on geographies consisting of 224,855,806 people shows a poor negative correlation between the proportion of Laotians and percentage of population with a disability in the United States with a correlation coefficient (R) of -0.159 and weighted average of 11.0%. Similarly, the statistical analysis conducted on geographies consisting of 94,018,396 people shows a poor negative correlation between the proportion of Ugandans and percentage of population with a disability in the United States with a correlation coefficient (R) of -0.169 and weighted average of 11.4%, a difference of 4.3%.
Disability Correlation Summary
| Measurement | Laotian | Ugandan |
| Minimum | 2.0% | 4.7% |
| Maximum | 25.4% | 25.9% |
| Range | 23.5% | 21.2% |
| Mean | 12.1% | 12.1% |
| Median | 11.6% | 11.1% |
| Interquartile 25% (IQ1) | 10.1% | 9.4% |
| Interquartile 75% (IQ3) | 14.1% | 13.4% |
| Interquartile Range (IQR) | 4.0% | 4.1% |
| Standard Deviation (Sample) | 4.6% | 4.3% |
| Standard Deviation (Population) | 4.5% | 4.3% |
Similar Demographics by Disability
Demographics Similar to Laotians by Disability
In terms of disability, the demographic groups most similar to Laotians are Bulgarian (11.0%, a difference of 0.010%), Immigrants from Sweden (11.0%, a difference of 0.030%), Colombian (11.0%, a difference of 0.080%), Immigrants from Afghanistan (11.0%, a difference of 0.20%), and Immigrants from Eritrea (11.0%, a difference of 0.21%).
| Demographics | Rating | Rank | Disability |
| Immigrants | Colombia | 99.7 /100 | #59 | Exceptional 10.9% |
| Zimbabweans | 99.7 /100 | #60 | Exceptional 10.9% |
| Immigrants | Bulgaria | 99.7 /100 | #61 | Exceptional 10.9% |
| Immigrants | Northern Africa | 99.7 /100 | #62 | Exceptional 10.9% |
| Immigrants | Eritrea | 99.7 /100 | #63 | Exceptional 11.0% |
| Immigrants | Sweden | 99.6 /100 | #64 | Exceptional 11.0% |
| Bulgarians | 99.6 /100 | #65 | Exceptional 11.0% |
| Laotians | 99.6 /100 | #66 | Exceptional 11.0% |
| Colombians | 99.6 /100 | #67 | Exceptional 11.0% |
| Immigrants | Afghanistan | 99.6 /100 | #68 | Exceptional 11.0% |
| Sri Lankans | 99.5 /100 | #69 | Exceptional 11.0% |
| Immigrants | France | 99.4 /100 | #70 | Exceptional 11.0% |
| Immigrants | Lebanon | 99.4 /100 | #71 | Exceptional 11.0% |
| Immigrants | Chile | 99.4 /100 | #72 | Exceptional 11.0% |
| Immigrants | Bangladesh | 99.4 /100 | #73 | Exceptional 11.0% |
Demographics Similar to Ugandans by Disability
In terms of disability, the demographic groups most similar to Ugandans are Immigrants from St. Vincent and the Grenadines (11.4%, a difference of 0.010%), Immigrants from Guyana (11.4%, a difference of 0.050%), Kenyan (11.5%, a difference of 0.080%), New Zealander (11.5%, a difference of 0.090%), and Ghanaian (11.5%, a difference of 0.10%).
| Demographics | Rating | Rank | Disability |
| Immigrants | Europe | 90.4 /100 | #128 | Exceptional 11.4% |
| Macedonians | 90.3 /100 | #129 | Exceptional 11.4% |
| Latvians | 89.8 /100 | #130 | Excellent 11.4% |
| Immigrants | Croatia | 89.8 /100 | #131 | Excellent 11.4% |
| Immigrants | Africa | 89.3 /100 | #132 | Excellent 11.4% |
| Arabs | 89.1 /100 | #133 | Excellent 11.4% |
| Immigrants | Guyana | 88.3 /100 | #134 | Excellent 11.4% |
| Ugandans | 87.9 /100 | #135 | Excellent 11.4% |
| Immigrants | St. Vincent and the Grenadines | 87.8 /100 | #136 | Excellent 11.4% |
| Kenyans | 87.1 /100 | #137 | Excellent 11.5% |
| New Zealanders | 87.0 /100 | #138 | Excellent 11.5% |
| Ghanaians | 87.0 /100 | #139 | Excellent 11.5% |
| Russians | 86.8 /100 | #140 | Excellent 11.5% |
| Immigrants | Grenada | 86.1 /100 | #141 | Excellent 11.5% |
| Immigrants | Sudan | 85.3 /100 | #142 | Excellent 11.5% |