Laotian vs Immigrants from Cameroon Disability
COMPARE
Laotian
Immigrants from Cameroon
Disability
Disability Comparison
Laotians
Immigrants from Cameroon
11.0%
DISABILITY
99.6/ 100
METRIC RATING
66th/ 347
METRIC RANK
11.1%
DISABILITY
99.3/ 100
METRIC RATING
78th/ 347
METRIC RANK
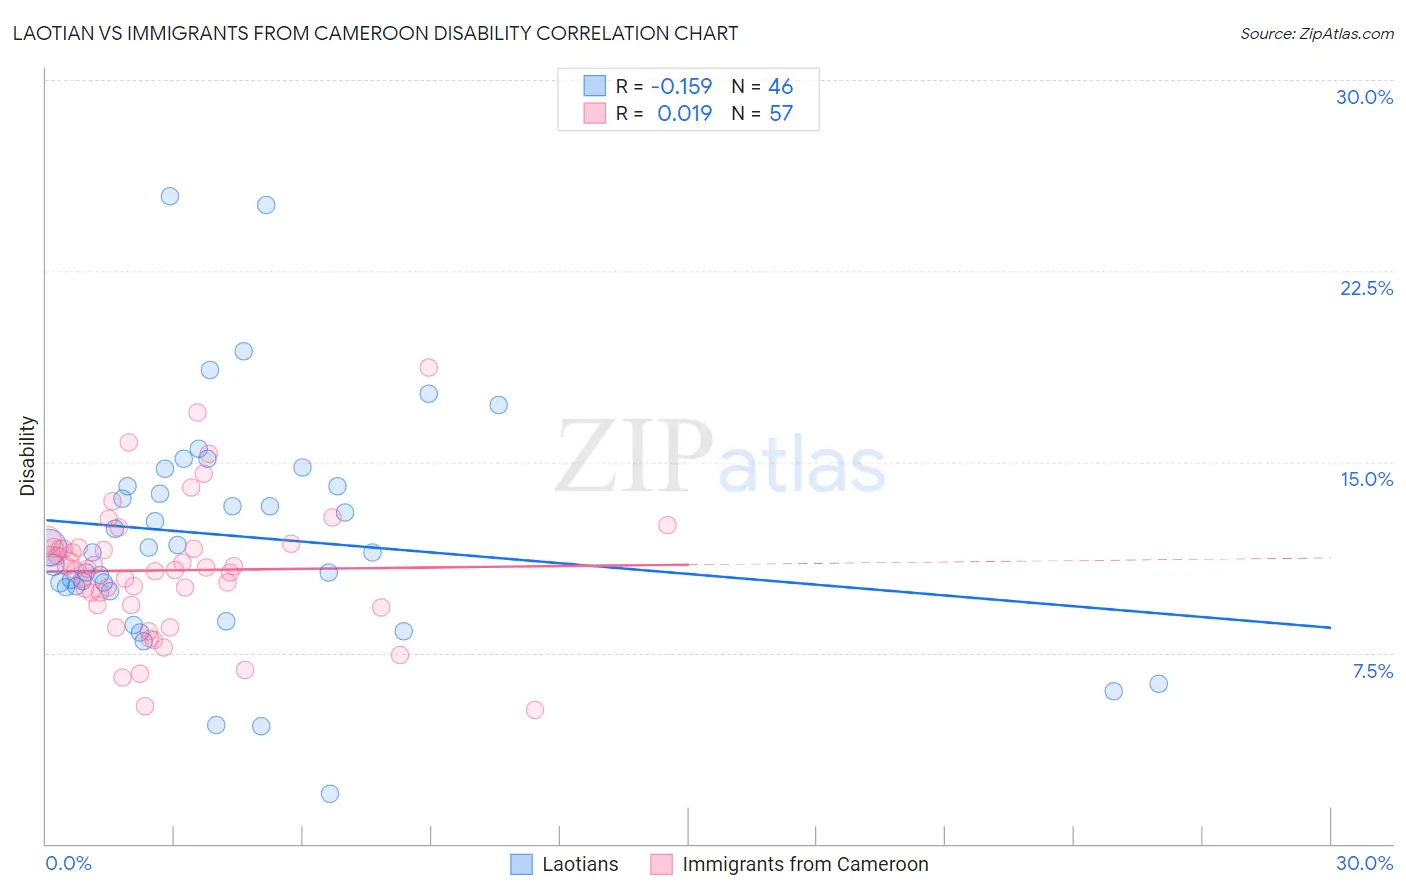
Laotian vs Immigrants from Cameroon Disability Correlation Chart
The statistical analysis conducted on geographies consisting of 224,855,806 people shows a poor negative correlation between the proportion of Laotians and percentage of population with a disability in the United States with a correlation coefficient (R) of -0.159 and weighted average of 11.0%. Similarly, the statistical analysis conducted on geographies consisting of 130,761,235 people shows no correlation between the proportion of Immigrants from Cameroon and percentage of population with a disability in the United States with a correlation coefficient (R) of 0.019 and weighted average of 11.1%, a difference of 0.73%.
Disability Correlation Summary
| Measurement | Laotian | Immigrants from Cameroon |
| Minimum | 2.0% | 5.2% |
| Maximum | 25.4% | 18.7% |
| Range | 23.5% | 13.5% |
| Mean | 12.1% | 10.7% |
| Median | 11.6% | 10.8% |
| Interquartile 25% (IQ1) | 10.1% | 9.4% |
| Interquartile 75% (IQ3) | 14.1% | 11.6% |
| Interquartile Range (IQR) | 4.0% | 2.3% |
| Standard Deviation (Sample) | 4.6% | 2.6% |
| Standard Deviation (Population) | 4.5% | 2.6% |
Demographics Similar to Laotians and Immigrants from Cameroon by Disability
In terms of disability, the demographic groups most similar to Laotians are Bulgarian (11.0%, a difference of 0.010%), Immigrants from Sweden (11.0%, a difference of 0.030%), Colombian (11.0%, a difference of 0.080%), Immigrants from Afghanistan (11.0%, a difference of 0.20%), and Immigrants from Eritrea (11.0%, a difference of 0.21%). Similarly, the demographic groups most similar to Immigrants from Cameroon are Sierra Leonean (11.0%, a difference of 0.040%), Immigrants from Belgium (11.0%, a difference of 0.040%), Immigrants from Jordan (11.1%, a difference of 0.040%), Immigrants from Vietnam (11.0%, a difference of 0.070%), and Immigrants from Ireland (11.1%, a difference of 0.080%).
| Demographics | Rating | Rank | Disability |
| Immigrants | Northern Africa | 99.7 /100 | #62 | Exceptional 10.9% |
| Immigrants | Eritrea | 99.7 /100 | #63 | Exceptional 11.0% |
| Immigrants | Sweden | 99.6 /100 | #64 | Exceptional 11.0% |
| Bulgarians | 99.6 /100 | #65 | Exceptional 11.0% |
| Laotians | 99.6 /100 | #66 | Exceptional 11.0% |
| Colombians | 99.6 /100 | #67 | Exceptional 11.0% |
| Immigrants | Afghanistan | 99.6 /100 | #68 | Exceptional 11.0% |
| Sri Lankans | 99.5 /100 | #69 | Exceptional 11.0% |
| Immigrants | France | 99.4 /100 | #70 | Exceptional 11.0% |
| Immigrants | Lebanon | 99.4 /100 | #71 | Exceptional 11.0% |
| Immigrants | Chile | 99.4 /100 | #72 | Exceptional 11.0% |
| Immigrants | Bangladesh | 99.4 /100 | #73 | Exceptional 11.0% |
| Immigrants | Serbia | 99.4 /100 | #74 | Exceptional 11.0% |
| Immigrants | Vietnam | 99.4 /100 | #75 | Exceptional 11.0% |
| Sierra Leoneans | 99.3 /100 | #76 | Exceptional 11.0% |
| Immigrants | Belgium | 99.3 /100 | #77 | Exceptional 11.0% |
| Immigrants | Cameroon | 99.3 /100 | #78 | Exceptional 11.1% |
| Immigrants | Jordan | 99.3 /100 | #79 | Exceptional 11.1% |
| Immigrants | Ireland | 99.3 /100 | #80 | Exceptional 11.1% |
| Immigrants | Poland | 99.1 /100 | #81 | Exceptional 11.1% |
| Chileans | 99.1 /100 | #82 | Exceptional 11.1% |