Laotian vs U.S. Virgin Islander Ambulatory Disability
COMPARE
Laotian
U.S. Virgin Islander
Ambulatory Disability
Ambulatory Disability Comparison
Laotians
U.S. Virgin Islanders
5.7%
AMBULATORY DISABILITY
99.7/ 100
METRIC RATING
64th/ 347
METRIC RANK
6.8%
AMBULATORY DISABILITY
0.0/ 100
METRIC RATING
287th/ 347
METRIC RANK
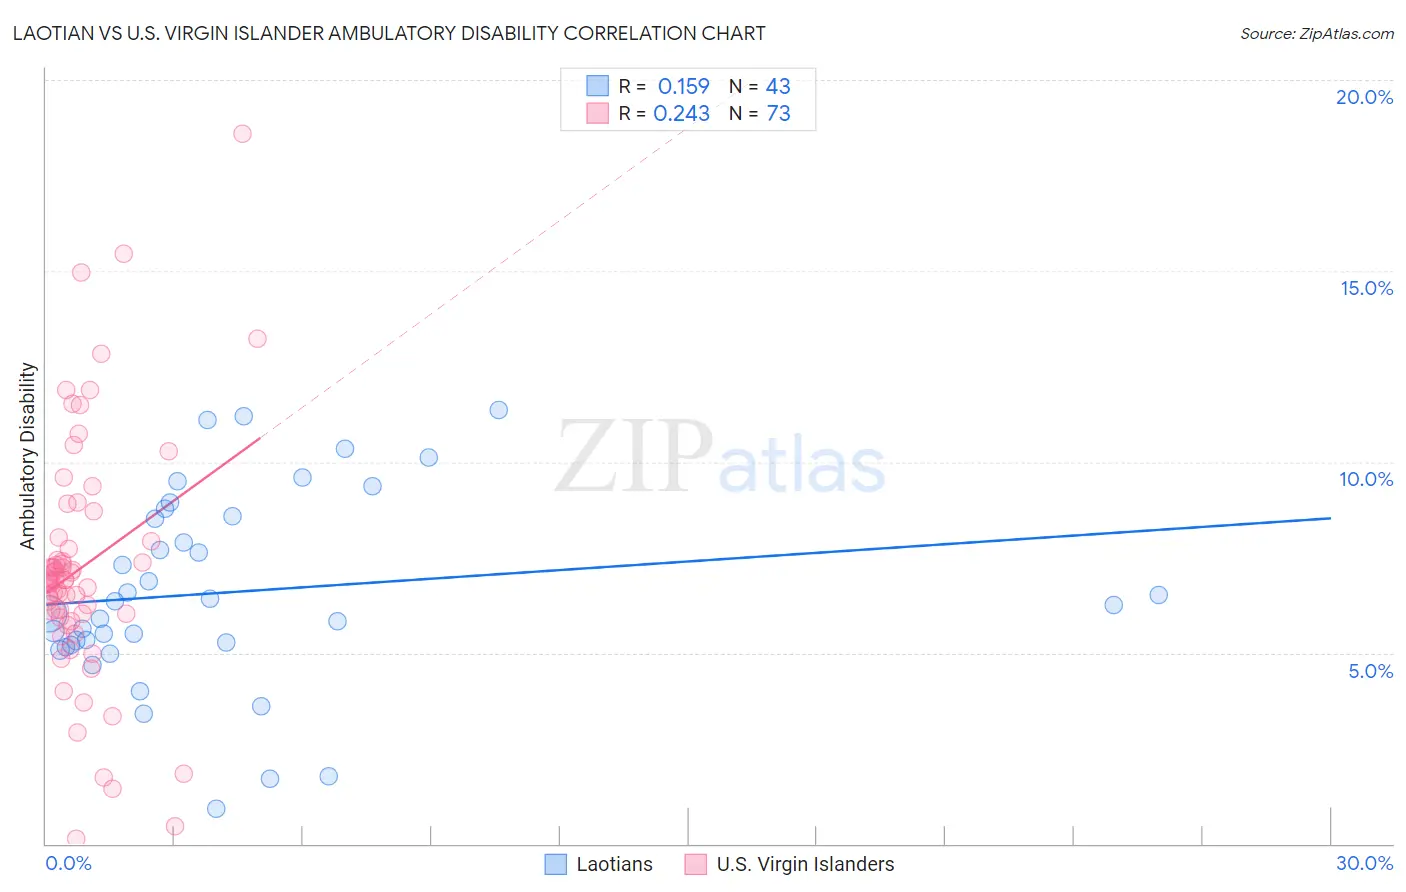
Laotian vs U.S. Virgin Islander Ambulatory Disability Correlation Chart
The statistical analysis conducted on geographies consisting of 224,814,363 people shows a poor positive correlation between the proportion of Laotians and percentage of population with ambulatory disability in the United States with a correlation coefficient (R) of 0.159 and weighted average of 5.7%. Similarly, the statistical analysis conducted on geographies consisting of 87,521,304 people shows a weak positive correlation between the proportion of U.S. Virgin Islanders and percentage of population with ambulatory disability in the United States with a correlation coefficient (R) of 0.243 and weighted average of 6.8%, a difference of 20.9%.
Ambulatory Disability Correlation Summary
| Measurement | Laotian | U.S. Virgin Islander |
| Minimum | 0.92% | 0.13% |
| Maximum | 11.4% | 18.6% |
| Range | 10.4% | 18.5% |
| Mean | 6.6% | 7.2% |
| Median | 6.2% | 6.9% |
| Interquartile 25% (IQ1) | 5.2% | 6.0% |
| Interquartile 75% (IQ3) | 8.6% | 8.0% |
| Interquartile Range (IQR) | 3.4% | 2.0% |
| Standard Deviation (Sample) | 2.5% | 3.2% |
| Standard Deviation (Population) | 2.5% | 3.2% |
Similar Demographics by Ambulatory Disability
Demographics Similar to Laotians by Ambulatory Disability
In terms of ambulatory disability, the demographic groups most similar to Laotians are Immigrants from Switzerland (5.7%, a difference of 0.030%), Israeli (5.7%, a difference of 0.12%), Immigrants from France (5.6%, a difference of 0.13%), Immigrants from Uganda (5.7%, a difference of 0.13%), and Sri Lankan (5.7%, a difference of 0.16%).
| Demographics | Rating | Rank | Ambulatory Disability |
| Immigrants | Brazil | 99.8 /100 | #57 | Exceptional 5.6% |
| Immigrants | Zimbabwe | 99.8 /100 | #58 | Exceptional 5.6% |
| Immigrants | Afghanistan | 99.8 /100 | #59 | Exceptional 5.6% |
| Immigrants | Lithuania | 99.8 /100 | #60 | Exceptional 5.6% |
| Immigrants | Belgium | 99.7 /100 | #61 | Exceptional 5.6% |
| Immigrants | Spain | 99.7 /100 | #62 | Exceptional 5.6% |
| Immigrants | France | 99.7 /100 | #63 | Exceptional 5.6% |
| Laotians | 99.7 /100 | #64 | Exceptional 5.7% |
| Immigrants | Switzerland | 99.7 /100 | #65 | Exceptional 5.7% |
| Israelis | 99.6 /100 | #66 | Exceptional 5.7% |
| Immigrants | Uganda | 99.6 /100 | #67 | Exceptional 5.7% |
| Sri Lankans | 99.6 /100 | #68 | Exceptional 5.7% |
| Peruvians | 99.5 /100 | #69 | Exceptional 5.7% |
| Sierra Leoneans | 99.4 /100 | #70 | Exceptional 5.7% |
| Immigrants | Peru | 99.4 /100 | #71 | Exceptional 5.7% |
Demographics Similar to U.S. Virgin Islanders by Ambulatory Disability
In terms of ambulatory disability, the demographic groups most similar to U.S. Virgin Islanders are Nonimmigrants (6.9%, a difference of 0.27%), Yakama (6.8%, a difference of 0.32%), Fijian (6.8%, a difference of 0.36%), Immigrants from Dominica (6.9%, a difference of 0.41%), and Scotch-Irish (6.9%, a difference of 0.44%).
| Demographics | Rating | Rank | Ambulatory Disability |
| Pennsylvania Germans | 0.0 /100 | #280 | Tragic 6.8% |
| Yaqui | 0.0 /100 | #281 | Tragic 6.8% |
| Barbadians | 0.0 /100 | #282 | Tragic 6.8% |
| Immigrants | Barbados | 0.0 /100 | #283 | Tragic 6.8% |
| Immigrants | Jamaica | 0.0 /100 | #284 | Tragic 6.8% |
| Fijians | 0.0 /100 | #285 | Tragic 6.8% |
| Yakama | 0.0 /100 | #286 | Tragic 6.8% |
| U.S. Virgin Islanders | 0.0 /100 | #287 | Tragic 6.8% |
| Immigrants | Nonimmigrants | 0.0 /100 | #288 | Tragic 6.9% |
| Immigrants | Dominica | 0.0 /100 | #289 | Tragic 6.9% |
| Scotch-Irish | 0.0 /100 | #290 | Tragic 6.9% |
| West Indians | 0.0 /100 | #291 | Tragic 6.9% |
| Cheyenne | 0.0 /100 | #292 | Tragic 6.9% |
| Immigrants | St. Vincent and the Grenadines | 0.0 /100 | #293 | Tragic 6.9% |
| Cape Verdeans | 0.0 /100 | #294 | Tragic 6.9% |