Kenyan vs Immigrants from Serbia Vision Disability
COMPARE
Kenyan
Immigrants from Serbia
Vision Disability
Vision Disability Comparison
Kenyans
Immigrants from Serbia
2.1%
VISION DISABILITY
92.5/ 100
METRIC RATING
113th/ 347
METRIC RANK
2.0%
VISION DISABILITY
99.4/ 100
METRIC RATING
52nd/ 347
METRIC RANK
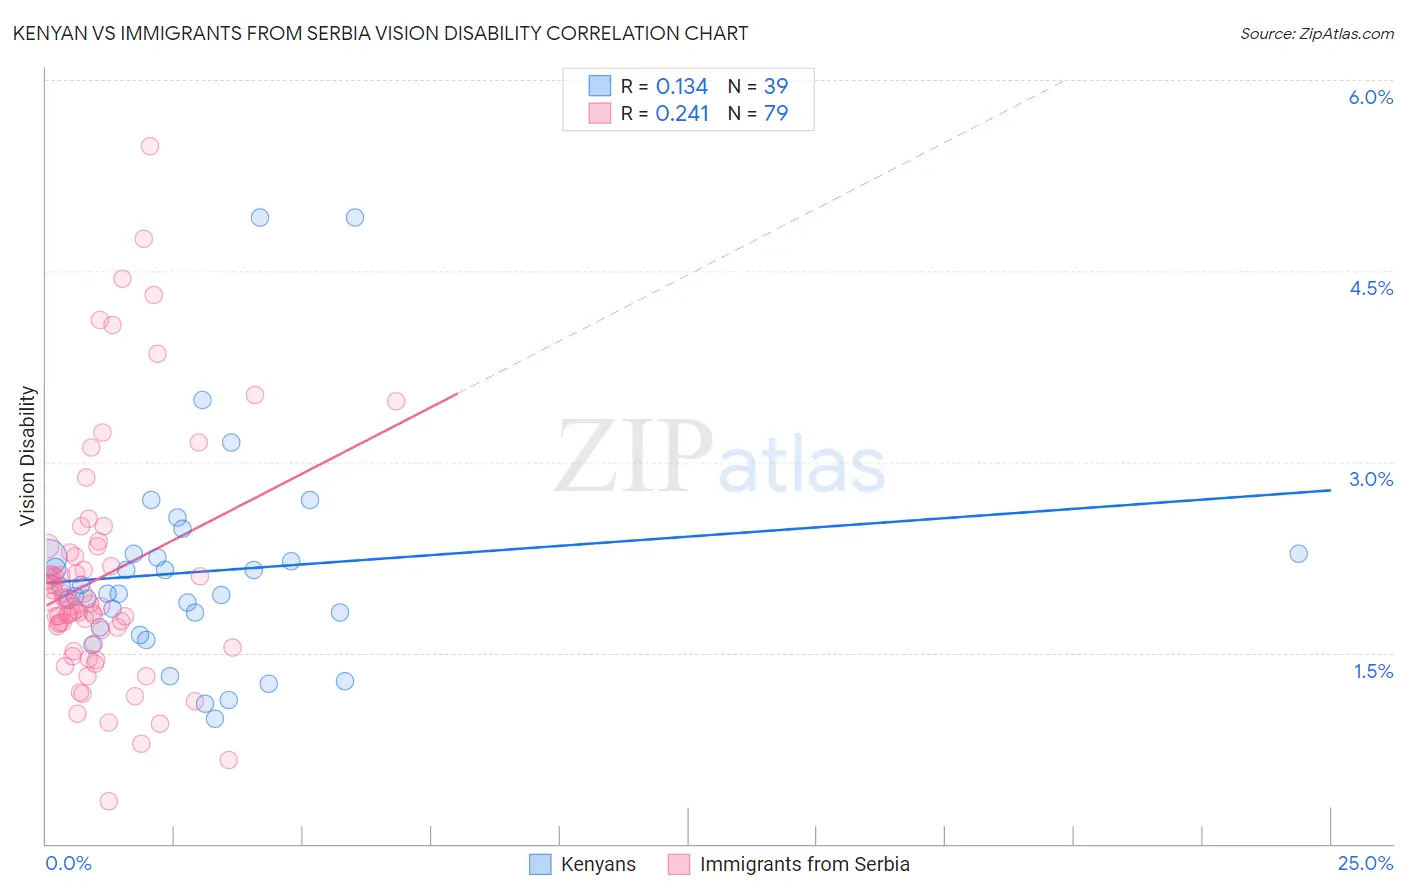
Kenyan vs Immigrants from Serbia Vision Disability Correlation Chart
The statistical analysis conducted on geographies consisting of 168,152,432 people shows a poor positive correlation between the proportion of Kenyans and percentage of population with vision disability in the United States with a correlation coefficient (R) of 0.134 and weighted average of 2.1%. Similarly, the statistical analysis conducted on geographies consisting of 131,728,789 people shows a weak positive correlation between the proportion of Immigrants from Serbia and percentage of population with vision disability in the United States with a correlation coefficient (R) of 0.241 and weighted average of 2.0%, a difference of 4.4%.
Vision Disability Correlation Summary
| Measurement | Kenyan | Immigrants from Serbia |
| Minimum | 0.99% | 0.34% |
| Maximum | 4.9% | 5.5% |
| Range | 3.9% | 5.1% |
| Mean | 2.1% | 2.1% |
| Median | 2.0% | 1.9% |
| Interquartile 25% (IQ1) | 1.7% | 1.6% |
| Interquartile 75% (IQ3) | 2.3% | 2.3% |
| Interquartile Range (IQR) | 0.58% | 0.72% |
| Standard Deviation (Sample) | 0.84% | 0.94% |
| Standard Deviation (Population) | 0.83% | 0.94% |
Similar Demographics by Vision Disability
Demographics Similar to Kenyans by Vision Disability
In terms of vision disability, the demographic groups most similar to Kenyans are Croatian (2.1%, a difference of 0.030%), Immigrants from Vietnam (2.1%, a difference of 0.060%), Ugandan (2.1%, a difference of 0.060%), Polish (2.1%, a difference of 0.11%), and Immigrants from Denmark (2.1%, a difference of 0.12%).
| Demographics | Rating | Rank | Vision Disability |
| Swedes | 94.2 /100 | #106 | Exceptional 2.1% |
| Danes | 94.2 /100 | #107 | Exceptional 2.1% |
| Koreans | 94.1 /100 | #108 | Exceptional 2.1% |
| Chileans | 94.0 /100 | #109 | Exceptional 2.1% |
| Immigrants | Armenia | 93.8 /100 | #110 | Exceptional 2.1% |
| Peruvians | 93.5 /100 | #111 | Exceptional 2.1% |
| Immigrants | Denmark | 92.9 /100 | #112 | Exceptional 2.1% |
| Kenyans | 92.5 /100 | #113 | Exceptional 2.1% |
| Croatians | 92.3 /100 | #114 | Exceptional 2.1% |
| Immigrants | Vietnam | 92.2 /100 | #115 | Exceptional 2.1% |
| Ugandans | 92.2 /100 | #116 | Exceptional 2.1% |
| Poles | 92.0 /100 | #117 | Exceptional 2.1% |
| Immigrants | Philippines | 91.4 /100 | #118 | Exceptional 2.1% |
| Immigrants | Uganda | 91.4 /100 | #119 | Exceptional 2.1% |
| Immigrants | Zimbabwe | 91.0 /100 | #120 | Exceptional 2.1% |
Demographics Similar to Immigrants from Serbia by Vision Disability
In terms of vision disability, the demographic groups most similar to Immigrants from Serbia are Immigrants from Belarus (2.0%, a difference of 0.11%), Macedonian (2.0%, a difference of 0.15%), Laotian (2.0%, a difference of 0.21%), Tongan (2.0%, a difference of 0.31%), and Jordanian (2.0%, a difference of 0.37%).
| Demographics | Rating | Rank | Vision Disability |
| Ethiopians | 99.7 /100 | #45 | Exceptional 2.0% |
| Immigrants | Sweden | 99.7 /100 | #46 | Exceptional 2.0% |
| Immigrants | Bulgaria | 99.7 /100 | #47 | Exceptional 2.0% |
| Israelis | 99.6 /100 | #48 | Exceptional 2.0% |
| Latvians | 99.5 /100 | #49 | Exceptional 2.0% |
| Afghans | 99.5 /100 | #50 | Exceptional 2.0% |
| Tongans | 99.5 /100 | #51 | Exceptional 2.0% |
| Immigrants | Serbia | 99.4 /100 | #52 | Exceptional 2.0% |
| Immigrants | Belarus | 99.3 /100 | #53 | Exceptional 2.0% |
| Macedonians | 99.3 /100 | #54 | Exceptional 2.0% |
| Laotians | 99.3 /100 | #55 | Exceptional 2.0% |
| Jordanians | 99.2 /100 | #56 | Exceptional 2.0% |
| Somalis | 99.2 /100 | #57 | Exceptional 2.0% |
| Immigrants | Saudi Arabia | 99.2 /100 | #58 | Exceptional 2.0% |
| Argentineans | 99.1 /100 | #59 | Exceptional 2.0% |