Kenyan vs Guatemalan Householder Income Ages 25 - 44 years
COMPARE
Kenyan
Guatemalan
Householder Income Ages 25 - 44 years
Householder Income Ages 25 - 44 years Comparison
Kenyans
Guatemalans
$91,684
HOUSEHOLDER INCOME AGES 25 - 44 YEARS
16.8/ 100
METRIC RATING
199th/ 347
METRIC RANK
$82,331
HOUSEHOLDER INCOME AGES 25 - 44 YEARS
0.1/ 100
METRIC RATING
283rd/ 347
METRIC RANK
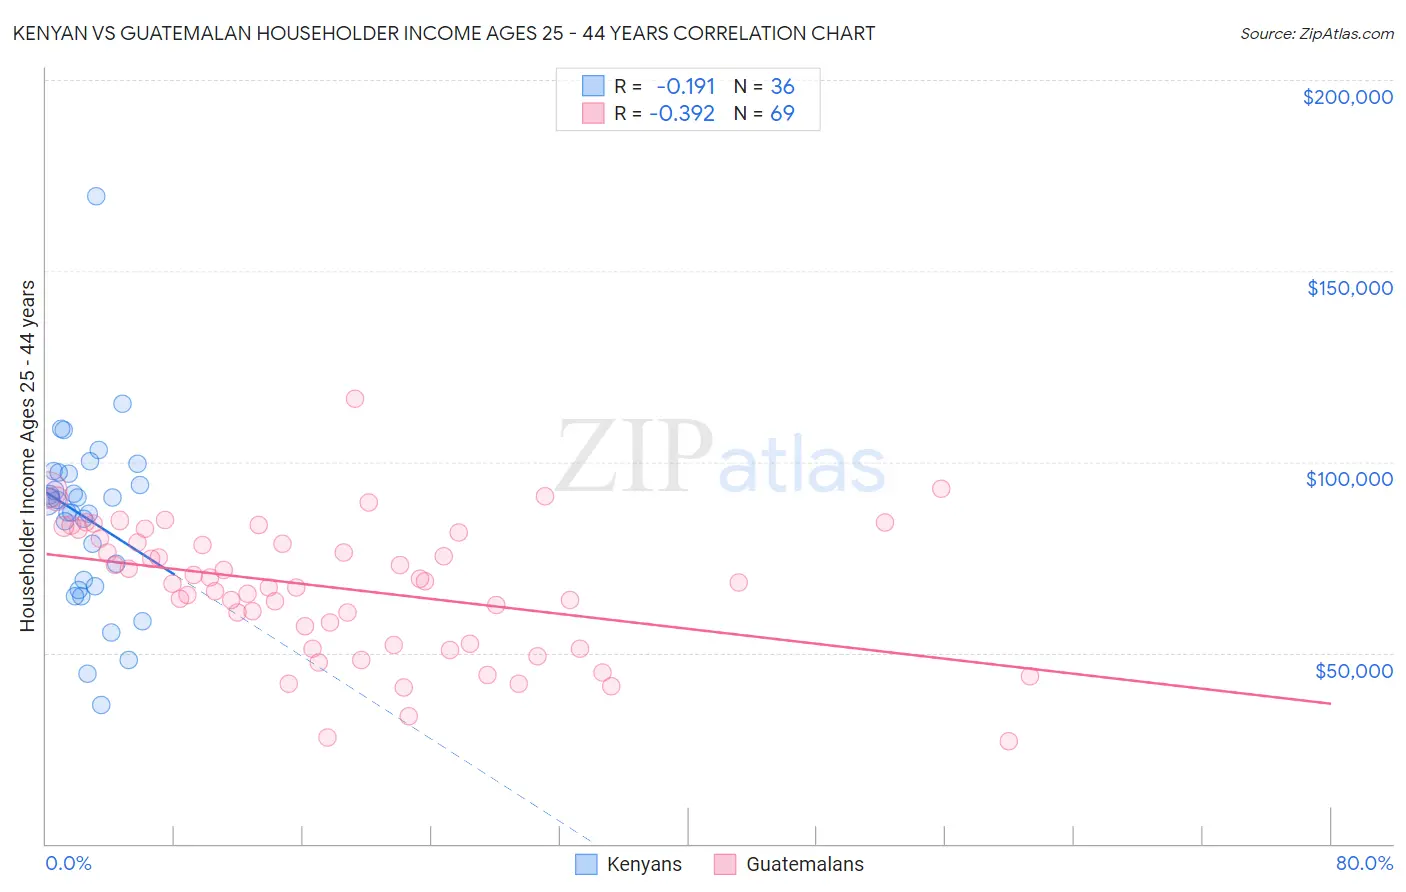
Kenyan vs Guatemalan Householder Income Ages 25 - 44 years Correlation Chart
The statistical analysis conducted on geographies consisting of 168,058,710 people shows a poor negative correlation between the proportion of Kenyans and household income with householder between the ages 25 and 44 in the United States with a correlation coefficient (R) of -0.191 and weighted average of $91,684. Similarly, the statistical analysis conducted on geographies consisting of 408,654,214 people shows a mild negative correlation between the proportion of Guatemalans and household income with householder between the ages 25 and 44 in the United States with a correlation coefficient (R) of -0.392 and weighted average of $82,331, a difference of 11.4%.
Householder Income Ages 25 - 44 years Correlation Summary
| Measurement | Kenyan | Guatemalan |
| Minimum | $36,414 | $26,896 |
| Maximum | $169,412 | $116,391 |
| Range | $132,998 | $89,495 |
| Mean | $85,374 | $66,998 |
| Median | $89,858 | $68,529 |
| Interquartile 25% (IQ1) | $68,236 | $52,170 |
| Interquartile 75% (IQ3) | $97,027 | $80,667 |
| Interquartile Range (IQR) | $28,791 | $28,496 |
| Standard Deviation (Sample) | $23,657 | $17,389 |
| Standard Deviation (Population) | $23,326 | $17,262 |
Similar Demographics by Householder Income Ages 25 - 44 years
Demographics Similar to Kenyans by Householder Income Ages 25 - 44 years
In terms of householder income ages 25 - 44 years, the demographic groups most similar to Kenyans are White/Caucasian ($91,668, a difference of 0.020%), Japanese ($91,624, a difference of 0.070%), Ecuadorian ($91,574, a difference of 0.12%), Immigrants from Cambodia ($91,533, a difference of 0.16%), and Nepalese ($91,498, a difference of 0.20%).
| Demographics | Rating | Rank | Householder Income Ages 25 - 44 years |
| Immigrants | Costa Rica | 28.2 /100 | #192 | Fair $92,876 |
| Samoans | 23.0 /100 | #193 | Fair $92,385 |
| Immigrants | Azores | 22.4 /100 | #194 | Fair $92,322 |
| Celtics | 21.6 /100 | #195 | Fair $92,241 |
| Immigrants | Colombia | 21.3 /100 | #196 | Fair $92,204 |
| Spanish | 21.2 /100 | #197 | Fair $92,200 |
| Vietnamese | 20.2 /100 | #198 | Fair $92,089 |
| Kenyans | 16.8 /100 | #199 | Poor $91,684 |
| Whites/Caucasians | 16.7 /100 | #200 | Poor $91,668 |
| Japanese | 16.4 /100 | #201 | Poor $91,624 |
| Ecuadorians | 16.0 /100 | #202 | Poor $91,574 |
| Immigrants | Cambodia | 15.7 /100 | #203 | Poor $91,533 |
| Nepalese | 15.4 /100 | #204 | Poor $91,498 |
| Immigrants | Eastern Africa | 15.2 /100 | #205 | Poor $91,458 |
| Aleuts | 14.5 /100 | #206 | Poor $91,370 |
Demographics Similar to Guatemalans by Householder Income Ages 25 - 44 years
In terms of householder income ages 25 - 44 years, the demographic groups most similar to Guatemalans are Central American Indian ($82,355, a difference of 0.030%), Cajun ($82,393, a difference of 0.070%), Immigrants from Middle Africa ($82,254, a difference of 0.090%), Immigrants from Somalia ($82,188, a difference of 0.17%), and Ute ($82,166, a difference of 0.20%).
| Demographics | Rating | Rank | Householder Income Ages 25 - 44 years |
| Immigrants | Belize | 0.2 /100 | #276 | Tragic $83,141 |
| Paiute | 0.2 /100 | #277 | Tragic $82,984 |
| Senegalese | 0.2 /100 | #278 | Tragic $82,852 |
| Pima | 0.1 /100 | #279 | Tragic $82,821 |
| Colville | 0.1 /100 | #280 | Tragic $82,604 |
| Cajuns | 0.1 /100 | #281 | Tragic $82,393 |
| Central American Indians | 0.1 /100 | #282 | Tragic $82,355 |
| Guatemalans | 0.1 /100 | #283 | Tragic $82,331 |
| Immigrants | Middle Africa | 0.1 /100 | #284 | Tragic $82,254 |
| Immigrants | Somalia | 0.1 /100 | #285 | Tragic $82,188 |
| Ute | 0.1 /100 | #286 | Tragic $82,166 |
| Immigrants | Latin America | 0.1 /100 | #287 | Tragic $82,166 |
| Comanche | 0.1 /100 | #288 | Tragic $82,152 |
| Shoshone | 0.1 /100 | #289 | Tragic $82,062 |
| Liberians | 0.1 /100 | #290 | Tragic $82,005 |