Kenyan vs Guatemalan Seniors Poverty Over the Age of 75
COMPARE
Kenyan
Guatemalan
Seniors Poverty Over the Age of 75
Seniors Poverty Over the Age of 75 Comparison
Kenyans
Guatemalans
11.5%
SENIORS POVERTY OVER THE AGE OF 75
93.9/ 100
METRIC RATING
92nd/ 347
METRIC RANK
14.8%
SENIORS POVERTY OVER THE AGE OF 75
0.0/ 100
METRIC RATING
283rd/ 347
METRIC RANK
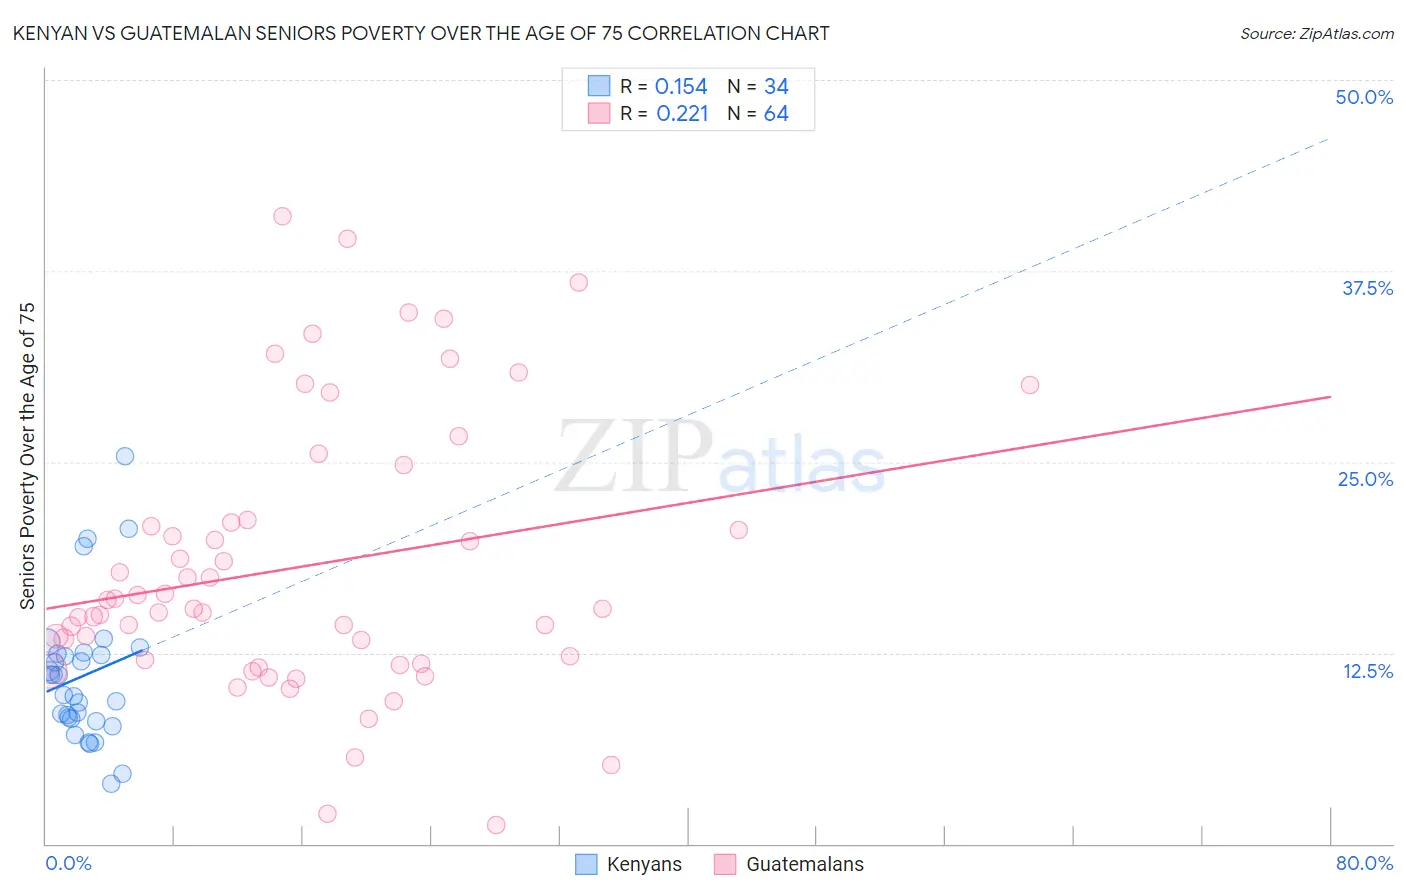
Kenyan vs Guatemalan Seniors Poverty Over the Age of 75 Correlation Chart
The statistical analysis conducted on geographies consisting of 167,184,352 people shows a poor positive correlation between the proportion of Kenyans and poverty level among seniors over the age of 75 in the United States with a correlation coefficient (R) of 0.154 and weighted average of 11.5%. Similarly, the statistical analysis conducted on geographies consisting of 405,055,105 people shows a weak positive correlation between the proportion of Guatemalans and poverty level among seniors over the age of 75 in the United States with a correlation coefficient (R) of 0.221 and weighted average of 14.8%, a difference of 28.5%.
Seniors Poverty Over the Age of 75 Correlation Summary
| Measurement | Kenyan | Guatemalan |
| Minimum | 3.9% | 1.2% |
| Maximum | 25.4% | 41.1% |
| Range | 21.5% | 39.8% |
| Mean | 11.0% | 18.2% |
| Median | 10.4% | 15.4% |
| Interquartile 25% (IQ1) | 8.2% | 11.9% |
| Interquartile 75% (IQ3) | 12.4% | 21.1% |
| Interquartile Range (IQR) | 4.2% | 9.2% |
| Standard Deviation (Sample) | 4.6% | 9.0% |
| Standard Deviation (Population) | 4.5% | 8.9% |
Similar Demographics by Seniors Poverty Over the Age of 75
Demographics Similar to Kenyans by Seniors Poverty Over the Age of 75
In terms of seniors poverty over the age of 75, the demographic groups most similar to Kenyans are Immigrants from Germany (11.5%, a difference of 0.070%), Aleut (11.5%, a difference of 0.080%), Immigrants from Sri Lanka (11.5%, a difference of 0.20%), Immigrants from Croatia (11.5%, a difference of 0.23%), and Korean (11.5%, a difference of 0.25%).
| Demographics | Rating | Rank | Seniors Poverty Over the Age of 75 |
| Immigrants | Bulgaria | 94.7 /100 | #85 | Exceptional 11.5% |
| Australians | 94.6 /100 | #86 | Exceptional 11.5% |
| Koreans | 94.5 /100 | #87 | Exceptional 11.5% |
| Immigrants | Croatia | 94.5 /100 | #88 | Exceptional 11.5% |
| Immigrants | Sri Lanka | 94.4 /100 | #89 | Exceptional 11.5% |
| Aleuts | 94.1 /100 | #90 | Exceptional 11.5% |
| Immigrants | Germany | 94.1 /100 | #91 | Exceptional 11.5% |
| Kenyans | 93.9 /100 | #92 | Exceptional 11.5% |
| Immigrants | Poland | 92.9 /100 | #93 | Exceptional 11.6% |
| Creek | 92.7 /100 | #94 | Exceptional 11.6% |
| Immigrants | Bosnia and Herzegovina | 92.6 /100 | #95 | Exceptional 11.6% |
| Immigrants | Sweden | 92.6 /100 | #96 | Exceptional 11.6% |
| Romanians | 92.3 /100 | #97 | Exceptional 11.6% |
| Immigrants | Japan | 91.9 /100 | #98 | Exceptional 11.6% |
| Immigrants | Ethiopia | 91.7 /100 | #99 | Exceptional 11.6% |
Demographics Similar to Guatemalans by Seniors Poverty Over the Age of 75
In terms of seniors poverty over the age of 75, the demographic groups most similar to Guatemalans are Immigrants from Senegal (14.8%, a difference of 0.060%), Belizean (14.8%, a difference of 0.24%), Central American (14.7%, a difference of 0.35%), Cheyenne (14.9%, a difference of 0.64%), and Immigrants from Mexico (14.9%, a difference of 0.83%).
| Demographics | Rating | Rank | Seniors Poverty Over the Age of 75 |
| Soviet Union | 0.0 /100 | #276 | Tragic 14.5% |
| Senegalese | 0.0 /100 | #277 | Tragic 14.5% |
| Immigrants | Colombia | 0.0 /100 | #278 | Tragic 14.6% |
| Blacks/African Americans | 0.0 /100 | #279 | Tragic 14.6% |
| Central Americans | 0.0 /100 | #280 | Tragic 14.7% |
| Belizeans | 0.0 /100 | #281 | Tragic 14.8% |
| Immigrants | Senegal | 0.0 /100 | #282 | Tragic 14.8% |
| Guatemalans | 0.0 /100 | #283 | Tragic 14.8% |
| Cheyenne | 0.0 /100 | #284 | Tragic 14.9% |
| Immigrants | Mexico | 0.0 /100 | #285 | Tragic 14.9% |
| Immigrants | Central America | 0.0 /100 | #286 | Tragic 15.0% |
| Immigrants | Guatemala | 0.0 /100 | #287 | Tragic 15.1% |
| Jamaicans | 0.0 /100 | #288 | Tragic 15.1% |
| Immigrants | Belize | 0.0 /100 | #289 | Tragic 15.2% |
| Immigrants | Azores | 0.0 /100 | #290 | Tragic 15.2% |