Guamanian/Chamorro vs White/Caucasian Disability Age 5 to 17
COMPARE
Guamanian/Chamorro
White/Caucasian
Disability Age 5 to 17
Disability Age 5 to 17 Comparison
Guamanians/Chamorros
Whites/Caucasians
5.8%
DISABILITY AGE 5 TO 17
5.6/ 100
METRIC RATING
225th/ 347
METRIC RANK
6.2%
DISABILITY AGE 5 TO 17
0.0/ 100
METRIC RATING
291st/ 347
METRIC RANK
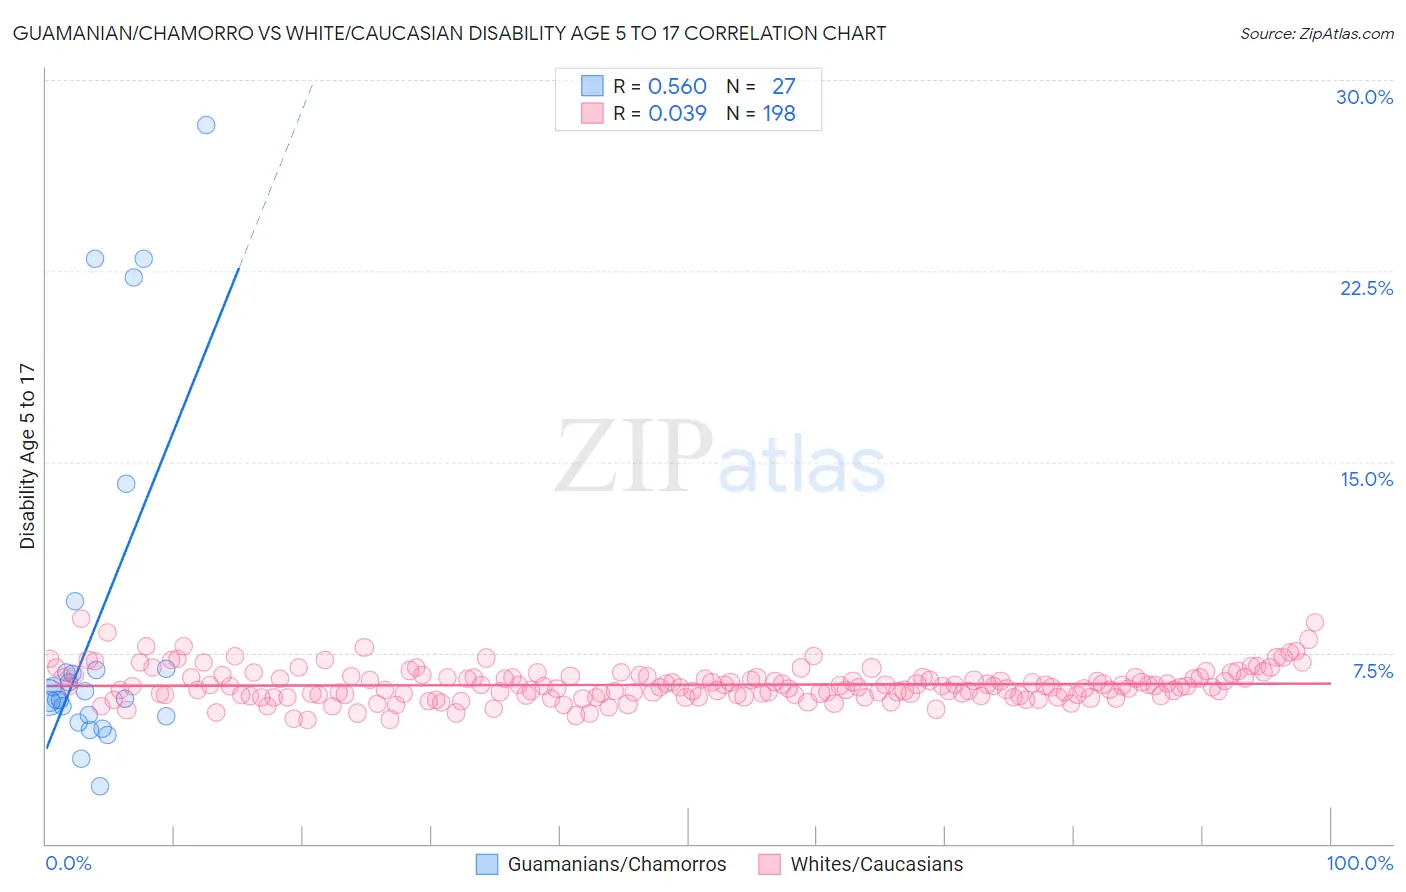
Guamanian/Chamorro vs White/Caucasian Disability Age 5 to 17 Correlation Chart
The statistical analysis conducted on geographies consisting of 221,078,318 people shows a substantial positive correlation between the proportion of Guamanians/Chamorros and percentage of population with a disability between the ages 5 and 17 in the United States with a correlation coefficient (R) of 0.560 and weighted average of 5.8%. Similarly, the statistical analysis conducted on geographies consisting of 566,464,467 people shows no correlation between the proportion of Whites/Caucasians and percentage of population with a disability between the ages 5 and 17 in the United States with a correlation coefficient (R) of 0.039 and weighted average of 6.2%, a difference of 7.0%.
Disability Age 5 to 17 Correlation Summary
| Measurement | Guamanian/Chamorro | White/Caucasian |
| Minimum | 2.3% | 4.9% |
| Maximum | 28.2% | 8.8% |
| Range | 26.0% | 4.0% |
| Mean | 8.6% | 6.2% |
| Median | 5.7% | 6.2% |
| Interquartile 25% (IQ1) | 5.0% | 5.8% |
| Interquartile 75% (IQ3) | 6.9% | 6.6% |
| Interquartile Range (IQR) | 1.9% | 0.72% |
| Standard Deviation (Sample) | 7.0% | 0.66% |
| Standard Deviation (Population) | 6.8% | 0.66% |
Similar Demographics by Disability Age 5 to 17
Demographics Similar to Guamanians/Chamorros by Disability Age 5 to 17
In terms of disability age 5 to 17, the demographic groups most similar to Guamanians/Chamorros are Mexican (5.8%, a difference of 0.020%), British West Indian (5.8%, a difference of 0.040%), Alsatian (5.8%, a difference of 0.080%), Swiss (5.8%, a difference of 0.12%), and Haitian (5.8%, a difference of 0.20%).
| Demographics | Rating | Rank | Disability Age 5 to 17 |
| Immigrants | Sierra Leone | 7.1 /100 | #218 | Tragic 5.8% |
| Sierra Leoneans | 7.0 /100 | #219 | Tragic 5.8% |
| Belgians | 6.9 /100 | #220 | Tragic 5.8% |
| Lithuanians | 6.7 /100 | #221 | Tragic 5.8% |
| Immigrants | Sudan | 6.7 /100 | #222 | Tragic 5.8% |
| Alsatians | 6.0 /100 | #223 | Tragic 5.8% |
| Mexicans | 5.7 /100 | #224 | Tragic 5.8% |
| Guamanians/Chamorros | 5.6 /100 | #225 | Tragic 5.8% |
| British West Indians | 5.4 /100 | #226 | Tragic 5.8% |
| Swiss | 5.1 /100 | #227 | Tragic 5.8% |
| Haitians | 4.8 /100 | #228 | Tragic 5.8% |
| Bangladeshis | 4.8 /100 | #229 | Tragic 5.8% |
| Ghanaians | 4.7 /100 | #230 | Tragic 5.8% |
| Europeans | 4.5 /100 | #231 | Tragic 5.8% |
| Immigrants | Laos | 3.8 /100 | #232 | Tragic 5.8% |
Demographics Similar to Whites/Caucasians by Disability Age 5 to 17
In terms of disability age 5 to 17, the demographic groups most similar to Whites/Caucasians are Jamaican (6.2%, a difference of 0.15%), Yaqui (6.2%, a difference of 0.15%), Immigrants from Congo (6.2%, a difference of 0.15%), Immigrants from Senegal (6.2%, a difference of 0.24%), and Central American Indian (6.2%, a difference of 0.26%).
| Demographics | Rating | Rank | Disability Age 5 to 17 |
| Sub-Saharan Africans | 0.0 /100 | #284 | Tragic 6.2% |
| English | 0.0 /100 | #285 | Tragic 6.2% |
| Colville | 0.0 /100 | #286 | Tragic 6.2% |
| Pima | 0.0 /100 | #287 | Tragic 6.2% |
| Jamaicans | 0.0 /100 | #288 | Tragic 6.2% |
| Yaqui | 0.0 /100 | #289 | Tragic 6.2% |
| Immigrants | Congo | 0.0 /100 | #290 | Tragic 6.2% |
| Whites/Caucasians | 0.0 /100 | #291 | Tragic 6.2% |
| Immigrants | Senegal | 0.0 /100 | #292 | Tragic 6.2% |
| Central American Indians | 0.0 /100 | #293 | Tragic 6.2% |
| Irish | 0.0 /100 | #294 | Tragic 6.2% |
| Cree | 0.0 /100 | #295 | Tragic 6.2% |
| Spanish Americans | 0.0 /100 | #296 | Tragic 6.2% |
| Immigrants | Bahamas | 0.0 /100 | #297 | Tragic 6.2% |
| Lumbee | 0.0 /100 | #298 | Tragic 6.2% |