Japanese vs Blackfeet Female Disability
COMPARE
Japanese
Blackfeet
Female Disability
Female Disability Comparison
Japanese
Blackfeet
12.6%
FEMALE DISABILITY
2.7/ 100
METRIC RATING
241st/ 347
METRIC RANK
13.8%
FEMALE DISABILITY
0.0/ 100
METRIC RATING
313th/ 347
METRIC RANK
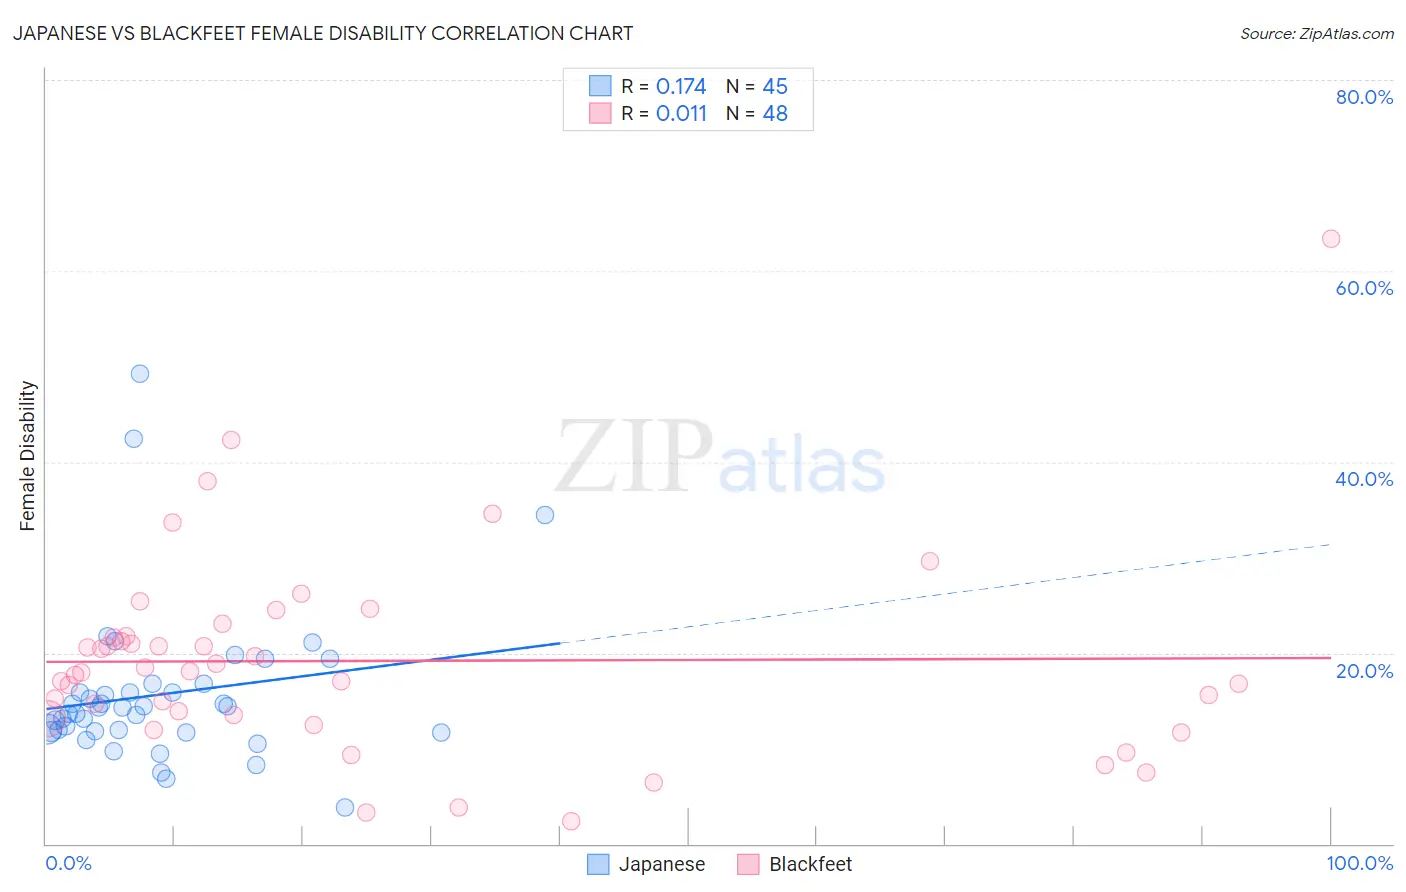
Japanese vs Blackfeet Female Disability Correlation Chart
The statistical analysis conducted on geographies consisting of 249,148,020 people shows a poor positive correlation between the proportion of Japanese and percentage of females with a disability in the United States with a correlation coefficient (R) of 0.174 and weighted average of 12.6%. Similarly, the statistical analysis conducted on geographies consisting of 309,506,934 people shows no correlation between the proportion of Blackfeet and percentage of females with a disability in the United States with a correlation coefficient (R) of 0.011 and weighted average of 13.8%, a difference of 9.7%.
Female Disability Correlation Summary
| Measurement | Japanese | Blackfeet |
| Minimum | 3.8% | 2.3% |
| Maximum | 49.3% | 63.4% |
| Range | 45.4% | 61.1% |
| Mean | 15.6% | 19.1% |
| Median | 14.2% | 18.0% |
| Interquartile 25% (IQ1) | 11.8% | 13.3% |
| Interquartile 75% (IQ3) | 16.3% | 21.7% |
| Interquartile Range (IQR) | 4.6% | 8.4% |
| Standard Deviation (Sample) | 8.2% | 10.6% |
| Standard Deviation (Population) | 8.1% | 10.5% |
Similar Demographics by Female Disability
Demographics Similar to Japanese by Female Disability
In terms of female disability, the demographic groups most similar to Japanese are Canadian (12.6%, a difference of 0.050%), Immigrants from Senegal (12.6%, a difference of 0.060%), Alsatian (12.6%, a difference of 0.070%), German Russian (12.6%, a difference of 0.17%), and Immigrants from Jamaica (12.6%, a difference of 0.21%).
| Demographics | Rating | Rank | Female Disability |
| Scandinavians | 5.3 /100 | #234 | Tragic 12.5% |
| Malaysians | 5.0 /100 | #235 | Tragic 12.5% |
| Immigrants | West Indies | 4.4 /100 | #236 | Tragic 12.6% |
| Slavs | 3.8 /100 | #237 | Tragic 12.6% |
| Yugoslavians | 3.7 /100 | #238 | Tragic 12.6% |
| Barbadians | 3.6 /100 | #239 | Tragic 12.6% |
| German Russians | 3.2 /100 | #240 | Tragic 12.6% |
| Japanese | 2.7 /100 | #241 | Tragic 12.6% |
| Canadians | 2.6 /100 | #242 | Tragic 12.6% |
| Immigrants | Senegal | 2.5 /100 | #243 | Tragic 12.6% |
| Alsatians | 2.5 /100 | #244 | Tragic 12.6% |
| Immigrants | Jamaica | 2.2 /100 | #245 | Tragic 12.6% |
| Spanish American Indians | 2.1 /100 | #246 | Tragic 12.6% |
| Menominee | 2.1 /100 | #247 | Tragic 12.6% |
| Carpatho Rusyns | 2.0 /100 | #248 | Tragic 12.6% |
Demographics Similar to Blackfeet by Female Disability
In terms of female disability, the demographic groups most similar to Blackfeet are Puget Sound Salish (13.8%, a difference of 0.10%), Delaware (13.8%, a difference of 0.32%), Hopi (13.7%, a difference of 0.63%), Alaskan Athabascan (13.9%, a difference of 0.69%), and Apache (13.7%, a difference of 0.91%).
| Demographics | Rating | Rank | Female Disability |
| French Canadians | 0.0 /100 | #306 | Tragic 13.6% |
| Central American Indians | 0.0 /100 | #307 | Tragic 13.6% |
| Cree | 0.0 /100 | #308 | Tragic 13.7% |
| French American Indians | 0.0 /100 | #309 | Tragic 13.7% |
| Apache | 0.0 /100 | #310 | Tragic 13.7% |
| Hopi | 0.0 /100 | #311 | Tragic 13.7% |
| Delaware | 0.0 /100 | #312 | Tragic 13.8% |
| Blackfeet | 0.0 /100 | #313 | Tragic 13.8% |
| Puget Sound Salish | 0.0 /100 | #314 | Tragic 13.8% |
| Alaskan Athabascans | 0.0 /100 | #315 | Tragic 13.9% |
| Spanish Americans | 0.0 /100 | #316 | Tragic 14.0% |
| Chippewa | 0.0 /100 | #317 | Tragic 14.0% |
| Paiute | 0.0 /100 | #318 | Tragic 14.0% |
| Iroquois | 0.0 /100 | #319 | Tragic 14.0% |
| Americans | 0.0 /100 | #320 | Tragic 14.1% |