Japanese vs Trinidadian and Tobagonian 9th Grade
COMPARE
Japanese
Trinidadian and Tobagonian
9th Grade
9th Grade Comparison
Japanese
Trinidadians and Tobagonians
92.6%
9TH GRADE
0.0/ 100
METRIC RATING
305th/ 347
METRIC RANK
93.7%
9TH GRADE
0.1/ 100
METRIC RATING
279th/ 347
METRIC RANK
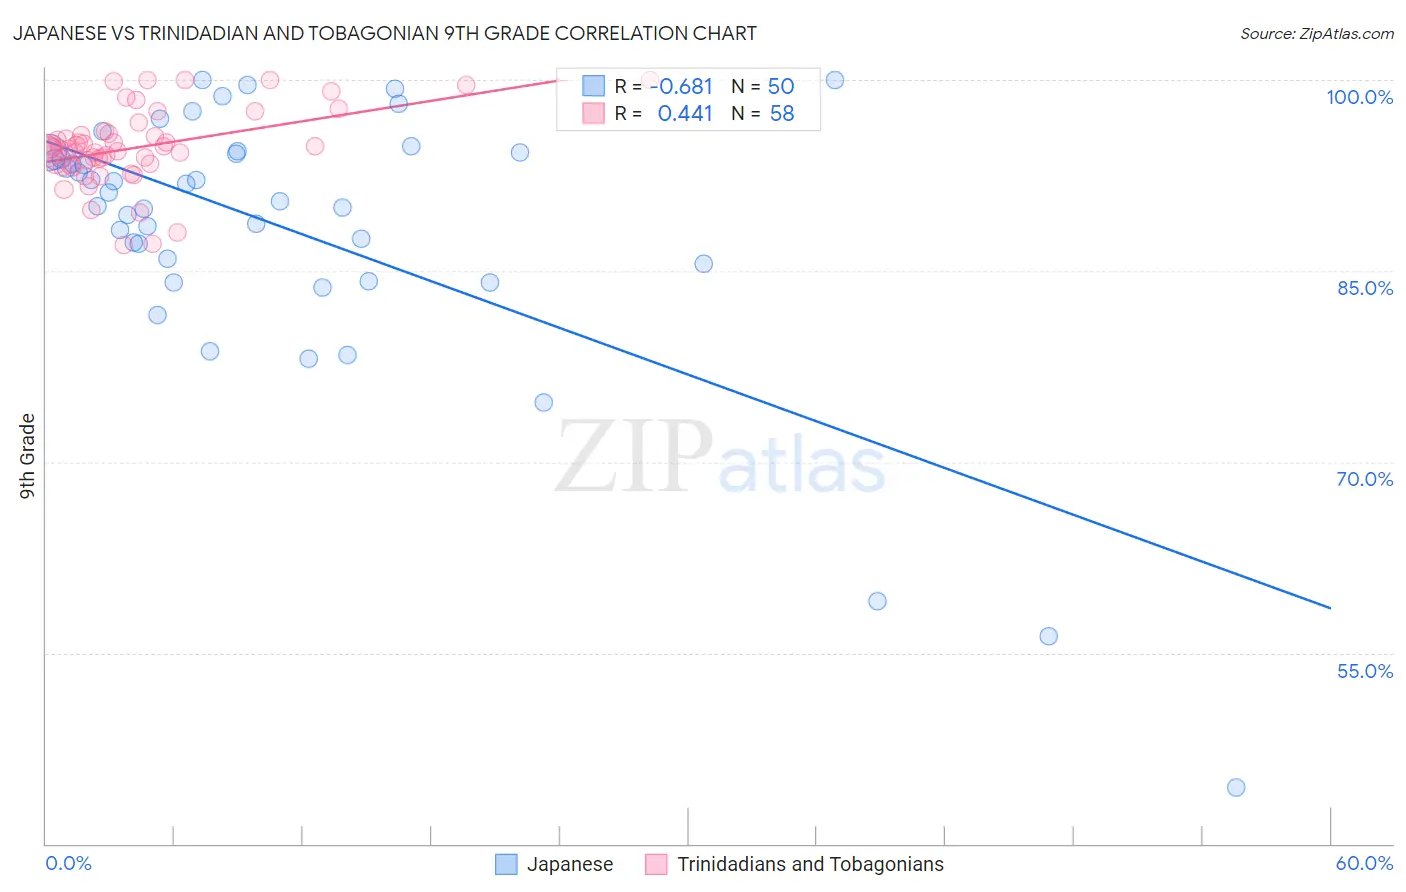
Japanese vs Trinidadian and Tobagonian 9th Grade Correlation Chart
The statistical analysis conducted on geographies consisting of 249,183,224 people shows a significant negative correlation between the proportion of Japanese and percentage of population with at least 9th grade education in the United States with a correlation coefficient (R) of -0.681 and weighted average of 92.6%. Similarly, the statistical analysis conducted on geographies consisting of 219,881,170 people shows a moderate positive correlation between the proportion of Trinidadians and Tobagonians and percentage of population with at least 9th grade education in the United States with a correlation coefficient (R) of 0.441 and weighted average of 93.7%, a difference of 1.1%.
9th Grade Correlation Summary
| Measurement | Japanese | Trinidadian and Tobagonian |
| Minimum | 44.4% | 87.0% |
| Maximum | 100.0% | 100.0% |
| Range | 55.6% | 13.0% |
| Mean | 88.3% | 94.7% |
| Median | 90.8% | 94.6% |
| Interquartile 25% (IQ1) | 85.6% | 93.3% |
| Interquartile 75% (IQ3) | 94.3% | 95.8% |
| Interquartile Range (IQR) | 8.7% | 2.5% |
| Standard Deviation (Sample) | 10.9% | 3.0% |
| Standard Deviation (Population) | 10.8% | 3.0% |
Similar Demographics by 9th Grade
Demographics Similar to Japanese by 9th Grade
In terms of 9th grade, the demographic groups most similar to Japanese are Immigrants from Vietnam (92.6%, a difference of 0.0%), Tohono O'odham (92.6%, a difference of 0.020%), Guyanese (92.7%, a difference of 0.040%), Immigrants from Dominica (92.7%, a difference of 0.060%), and Immigrants (92.5%, a difference of 0.10%).
| Demographics | Rating | Rank | 9th Grade |
| Haitians | 0.0 /100 | #298 | Tragic 93.1% |
| Immigrants | Grenada | 0.0 /100 | #299 | Tragic 93.0% |
| Yaqui | 0.0 /100 | #300 | Tragic 92.9% |
| Immigrants | Haiti | 0.0 /100 | #301 | Tragic 92.7% |
| Immigrants | Dominica | 0.0 /100 | #302 | Tragic 92.7% |
| Guyanese | 0.0 /100 | #303 | Tragic 92.7% |
| Tohono O'odham | 0.0 /100 | #304 | Tragic 92.6% |
| Japanese | 0.0 /100 | #305 | Tragic 92.6% |
| Immigrants | Vietnam | 0.0 /100 | #306 | Tragic 92.6% |
| Immigrants | Immigrants | 0.0 /100 | #307 | Tragic 92.5% |
| Immigrants | Guyana | 0.0 /100 | #308 | Tragic 92.5% |
| Immigrants | Bangladesh | 0.0 /100 | #309 | Tragic 92.4% |
| Immigrants | Cambodia | 0.0 /100 | #310 | Tragic 92.4% |
| Immigrants | Fiji | 0.0 /100 | #311 | Tragic 92.3% |
| Houma | 0.0 /100 | #312 | Tragic 92.3% |
Demographics Similar to Trinidadians and Tobagonians by 9th Grade
In terms of 9th grade, the demographic groups most similar to Trinidadians and Tobagonians are Immigrants from Philippines (93.7%, a difference of 0.060%), Immigrants from Eritrea (93.7%, a difference of 0.060%), West Indian (93.7%, a difference of 0.070%), Immigrants from Colombia (93.8%, a difference of 0.080%), and Taiwanese (93.6%, a difference of 0.080%).
| Demographics | Rating | Rank | 9th Grade |
| Immigrants | Western Africa | 0.2 /100 | #272 | Tragic 93.8% |
| Immigrants | South America | 0.2 /100 | #273 | Tragic 93.8% |
| Peruvians | 0.2 /100 | #274 | Tragic 93.8% |
| Immigrants | Colombia | 0.2 /100 | #275 | Tragic 93.8% |
| West Indians | 0.2 /100 | #276 | Tragic 93.7% |
| Immigrants | Philippines | 0.1 /100 | #277 | Tragic 93.7% |
| Immigrants | Eritrea | 0.1 /100 | #278 | Tragic 93.7% |
| Trinidadians and Tobagonians | 0.1 /100 | #279 | Tragic 93.7% |
| Taiwanese | 0.1 /100 | #280 | Tragic 93.6% |
| Immigrants | Trinidad and Tobago | 0.1 /100 | #281 | Tragic 93.6% |
| Malaysians | 0.0 /100 | #282 | Tragic 93.5% |
| Barbadians | 0.0 /100 | #283 | Tragic 93.5% |
| Bangladeshis | 0.0 /100 | #284 | Tragic 93.4% |
| Immigrants | Peru | 0.0 /100 | #285 | Tragic 93.4% |
| Immigrants | Barbados | 0.0 /100 | #286 | Tragic 93.4% |