Japanese vs Trinidadian and Tobagonian Unemployment
COMPARE
Japanese
Trinidadian and Tobagonian
Unemployment
Unemployment Comparison
Japanese
Trinidadians and Tobagonians
5.6%
UNEMPLOYMENT
0.8/ 100
METRIC RATING
250th/ 347
METRIC RANK
6.3%
UNEMPLOYMENT
0.0/ 100
METRIC RATING
301st/ 347
METRIC RANK
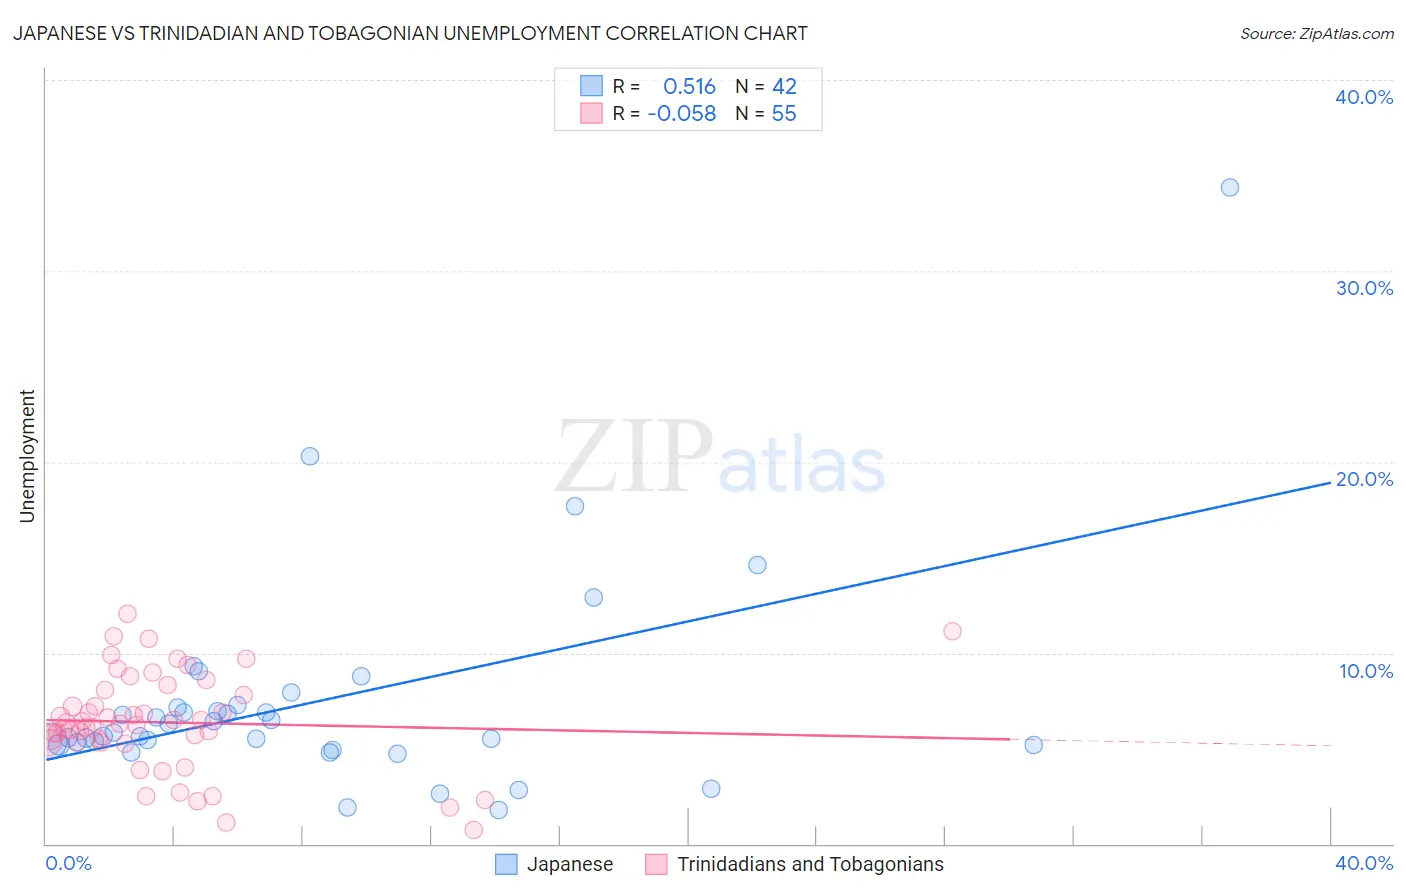
Japanese vs Trinidadian and Tobagonian Unemployment Correlation Chart
The statistical analysis conducted on geographies consisting of 249,076,576 people shows a substantial positive correlation between the proportion of Japanese and unemployment in the United States with a correlation coefficient (R) of 0.516 and weighted average of 5.6%. Similarly, the statistical analysis conducted on geographies consisting of 219,752,630 people shows a slight negative correlation between the proportion of Trinidadians and Tobagonians and unemployment in the United States with a correlation coefficient (R) of -0.058 and weighted average of 6.3%, a difference of 12.3%.
Unemployment Correlation Summary
| Measurement | Japanese | Trinidadian and Tobagonian |
| Minimum | 1.8% | 0.70% |
| Maximum | 34.4% | 12.0% |
| Range | 32.6% | 11.3% |
| Mean | 7.4% | 6.4% |
| Median | 5.8% | 6.3% |
| Interquartile 25% (IQ1) | 5.2% | 5.3% |
| Interquartile 75% (IQ3) | 7.1% | 8.1% |
| Interquartile Range (IQR) | 1.9% | 2.7% |
| Standard Deviation (Sample) | 5.6% | 2.6% |
| Standard Deviation (Population) | 5.6% | 2.6% |
Similar Demographics by Unemployment
Demographics Similar to Japanese by Unemployment
In terms of unemployment, the demographic groups most similar to Japanese are Cajun (5.6%, a difference of 0.010%), Liberian (5.6%, a difference of 0.27%), Immigrants from Cameroon (5.6%, a difference of 0.40%), Kiowa (5.7%, a difference of 0.47%), and Bermudan (5.6%, a difference of 0.55%).
| Demographics | Rating | Rank | Unemployment |
| Marshallese | 1.3 /100 | #243 | Tragic 5.6% |
| Dutch West Indians | 1.2 /100 | #244 | Tragic 5.6% |
| French American Indians | 1.2 /100 | #245 | Tragic 5.6% |
| Bermudans | 1.1 /100 | #246 | Tragic 5.6% |
| Immigrants | Cameroon | 1.0 /100 | #247 | Tragic 5.6% |
| Liberians | 0.9 /100 | #248 | Tragic 5.6% |
| Cajuns | 0.8 /100 | #249 | Tragic 5.6% |
| Japanese | 0.8 /100 | #250 | Tragic 5.6% |
| Kiowa | 0.6 /100 | #251 | Tragic 5.7% |
| Hondurans | 0.3 /100 | #252 | Tragic 5.7% |
| Central Americans | 0.3 /100 | #253 | Tragic 5.7% |
| Immigrants | Honduras | 0.3 /100 | #254 | Tragic 5.7% |
| Immigrants | Portugal | 0.2 /100 | #255 | Tragic 5.7% |
| Guatemalans | 0.2 /100 | #256 | Tragic 5.8% |
| Yaqui | 0.2 /100 | #257 | Tragic 5.8% |
Demographics Similar to Trinidadians and Tobagonians by Unemployment
In terms of unemployment, the demographic groups most similar to Trinidadians and Tobagonians are West Indian (6.4%, a difference of 0.25%), Immigrants from Trinidad and Tobago (6.3%, a difference of 0.48%), Belizean (6.4%, a difference of 0.48%), Immigrants from West Indies (6.3%, a difference of 0.60%), and Immigrants from Haiti (6.3%, a difference of 0.65%).
| Demographics | Rating | Rank | Unemployment |
| Spanish American Indians | 0.0 /100 | #294 | Tragic 6.2% |
| U.S. Virgin Islanders | 0.0 /100 | #295 | Tragic 6.3% |
| Ute | 0.0 /100 | #296 | Tragic 6.3% |
| Jamaicans | 0.0 /100 | #297 | Tragic 6.3% |
| Immigrants | Haiti | 0.0 /100 | #298 | Tragic 6.3% |
| Immigrants | West Indies | 0.0 /100 | #299 | Tragic 6.3% |
| Immigrants | Trinidad and Tobago | 0.0 /100 | #300 | Tragic 6.3% |
| Trinidadians and Tobagonians | 0.0 /100 | #301 | Tragic 6.3% |
| West Indians | 0.0 /100 | #302 | Tragic 6.4% |
| Belizeans | 0.0 /100 | #303 | Tragic 6.4% |
| Immigrants | Jamaica | 0.0 /100 | #304 | Tragic 6.4% |
| Menominee | 0.0 /100 | #305 | Tragic 6.4% |
| Lumbee | 0.0 /100 | #306 | Tragic 6.4% |
| Immigrants | Bangladesh | 0.0 /100 | #307 | Tragic 6.5% |
| Barbadians | 0.0 /100 | #308 | Tragic 6.5% |