Immigrants from El Salvador vs Iroquois Disability
COMPARE
Immigrants from El Salvador
Iroquois
Disability
Disability Comparison
Immigrants from El Salvador
Iroquois
10.9%
DISABILITY
99.8/ 100
METRIC RATING
55th/ 347
METRIC RANK
13.8%
DISABILITY
0.0/ 100
METRIC RATING
319th/ 347
METRIC RANK
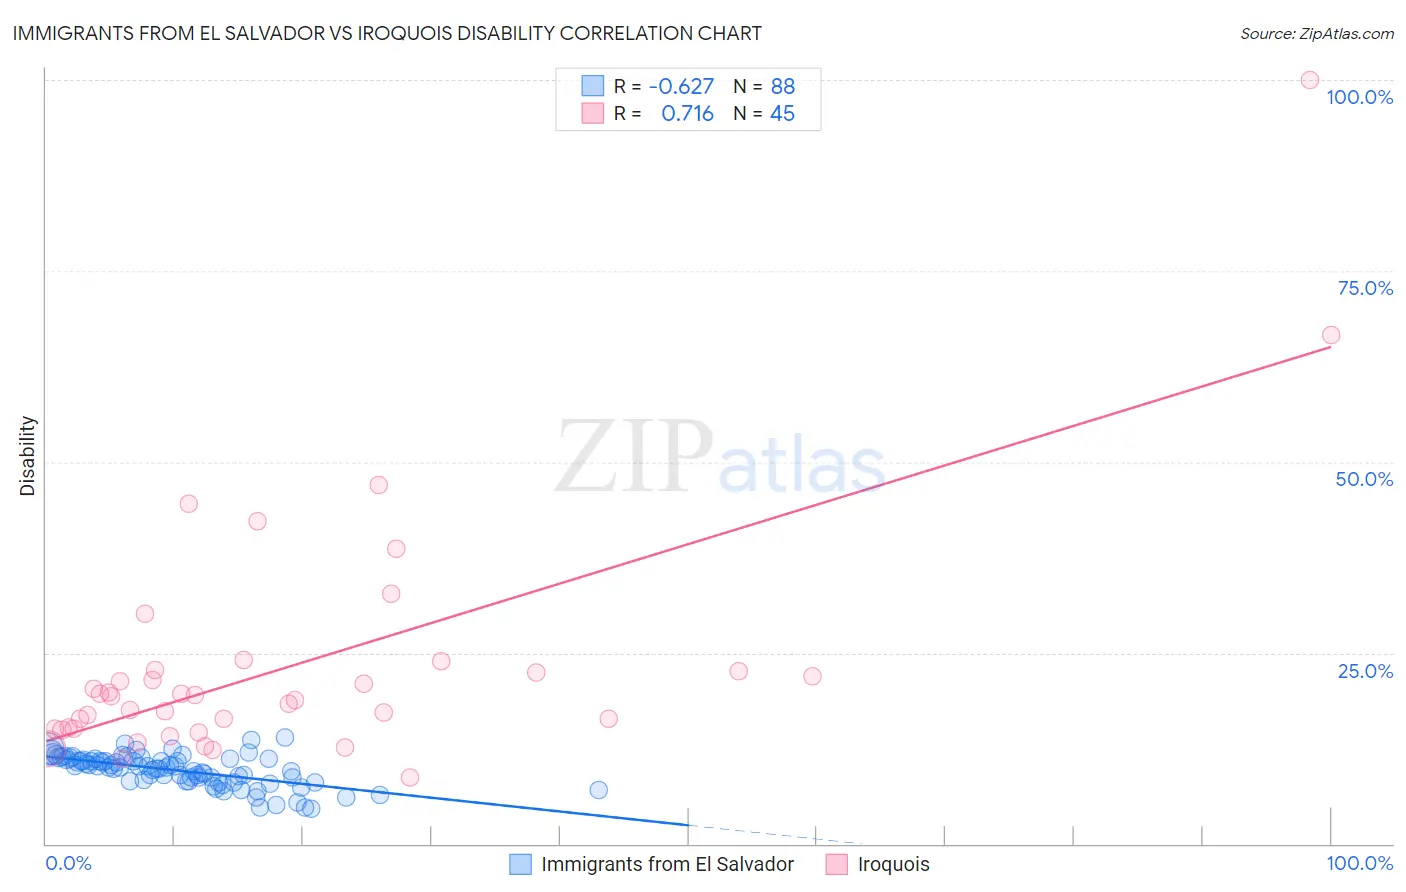
Immigrants from El Salvador vs Iroquois Disability Correlation Chart
The statistical analysis conducted on geographies consisting of 357,766,367 people shows a significant negative correlation between the proportion of Immigrants from El Salvador and percentage of population with a disability in the United States with a correlation coefficient (R) of -0.627 and weighted average of 10.9%. Similarly, the statistical analysis conducted on geographies consisting of 207,277,318 people shows a strong positive correlation between the proportion of Iroquois and percentage of population with a disability in the United States with a correlation coefficient (R) of 0.716 and weighted average of 13.8%, a difference of 27.0%.
Disability Correlation Summary
| Measurement | Immigrants from El Salvador | Iroquois |
| Minimum | 4.6% | 8.7% |
| Maximum | 13.9% | 100.0% |
| Range | 9.3% | 91.3% |
| Mean | 9.6% | 23.3% |
| Median | 10.0% | 19.3% |
| Interquartile 25% (IQ1) | 8.2% | 15.0% |
| Interquartile 75% (IQ3) | 11.0% | 22.7% |
| Interquartile Range (IQR) | 2.8% | 7.7% |
| Standard Deviation (Sample) | 2.0% | 16.0% |
| Standard Deviation (Population) | 2.0% | 15.8% |
Similar Demographics by Disability
Demographics Similar to Immigrants from El Salvador by Disability
In terms of disability, the demographic groups most similar to Immigrants from El Salvador are Immigrants from Spain (10.9%, a difference of 0.090%), Jordanian (10.9%, a difference of 0.090%), South American (10.9%, a difference of 0.11%), Immigrants from Lithuania (10.9%, a difference of 0.11%), and Peruvian (10.9%, a difference of 0.16%).
| Demographics | Rating | Rank | Disability |
| Soviet Union | 99.9 /100 | #48 | Exceptional 10.9% |
| Vietnamese | 99.9 /100 | #49 | Exceptional 10.9% |
| Immigrants | Saudi Arabia | 99.9 /100 | #50 | Exceptional 10.9% |
| Peruvians | 99.8 /100 | #51 | Exceptional 10.9% |
| South Americans | 99.8 /100 | #52 | Exceptional 10.9% |
| Immigrants | Spain | 99.8 /100 | #53 | Exceptional 10.9% |
| Jordanians | 99.8 /100 | #54 | Exceptional 10.9% |
| Immigrants | El Salvador | 99.8 /100 | #55 | Exceptional 10.9% |
| Immigrants | Lithuania | 99.8 /100 | #56 | Exceptional 10.9% |
| Salvadorans | 99.8 /100 | #57 | Exceptional 10.9% |
| Immigrants | South America | 99.8 /100 | #58 | Exceptional 10.9% |
| Immigrants | Colombia | 99.7 /100 | #59 | Exceptional 10.9% |
| Zimbabweans | 99.7 /100 | #60 | Exceptional 10.9% |
| Immigrants | Bulgaria | 99.7 /100 | #61 | Exceptional 10.9% |
| Immigrants | Northern Africa | 99.7 /100 | #62 | Exceptional 10.9% |
Demographics Similar to Iroquois by Disability
In terms of disability, the demographic groups most similar to Iroquois are Menominee (13.8%, a difference of 0.21%), Apache (13.9%, a difference of 0.29%), Paiute (13.9%, a difference of 0.42%), Pima (13.7%, a difference of 0.79%), and Immigrants from Cabo Verde (13.7%, a difference of 0.79%).
| Demographics | Rating | Rank | Disability |
| Spanish Americans | 0.0 /100 | #312 | Tragic 13.6% |
| Cree | 0.0 /100 | #313 | Tragic 13.7% |
| Blacks/African Americans | 0.0 /100 | #314 | Tragic 13.7% |
| Puget Sound Salish | 0.0 /100 | #315 | Tragic 13.7% |
| Pima | 0.0 /100 | #316 | Tragic 13.7% |
| Immigrants | Cabo Verde | 0.0 /100 | #317 | Tragic 13.7% |
| Menominee | 0.0 /100 | #318 | Tragic 13.8% |
| Iroquois | 0.0 /100 | #319 | Tragic 13.8% |
| Apache | 0.0 /100 | #320 | Tragic 13.9% |
| Paiute | 0.0 /100 | #321 | Tragic 13.9% |
| Americans | 0.0 /100 | #322 | Tragic 13.9% |
| Comanche | 0.0 /100 | #323 | Tragic 14.1% |
| Chippewa | 0.0 /100 | #324 | Tragic 14.1% |
| Natives/Alaskans | 0.0 /100 | #325 | Tragic 14.2% |
| Osage | 0.0 /100 | #326 | Tragic 14.2% |