British West Indian vs British Disability
COMPARE
British West Indian
British
Disability
Disability Comparison
British West Indians
British
12.0%
DISABILITY
11.5/ 100
METRIC RATING
203rd/ 347
METRIC RANK
12.2%
DISABILITY
1.5/ 100
METRIC RATING
243rd/ 347
METRIC RANK
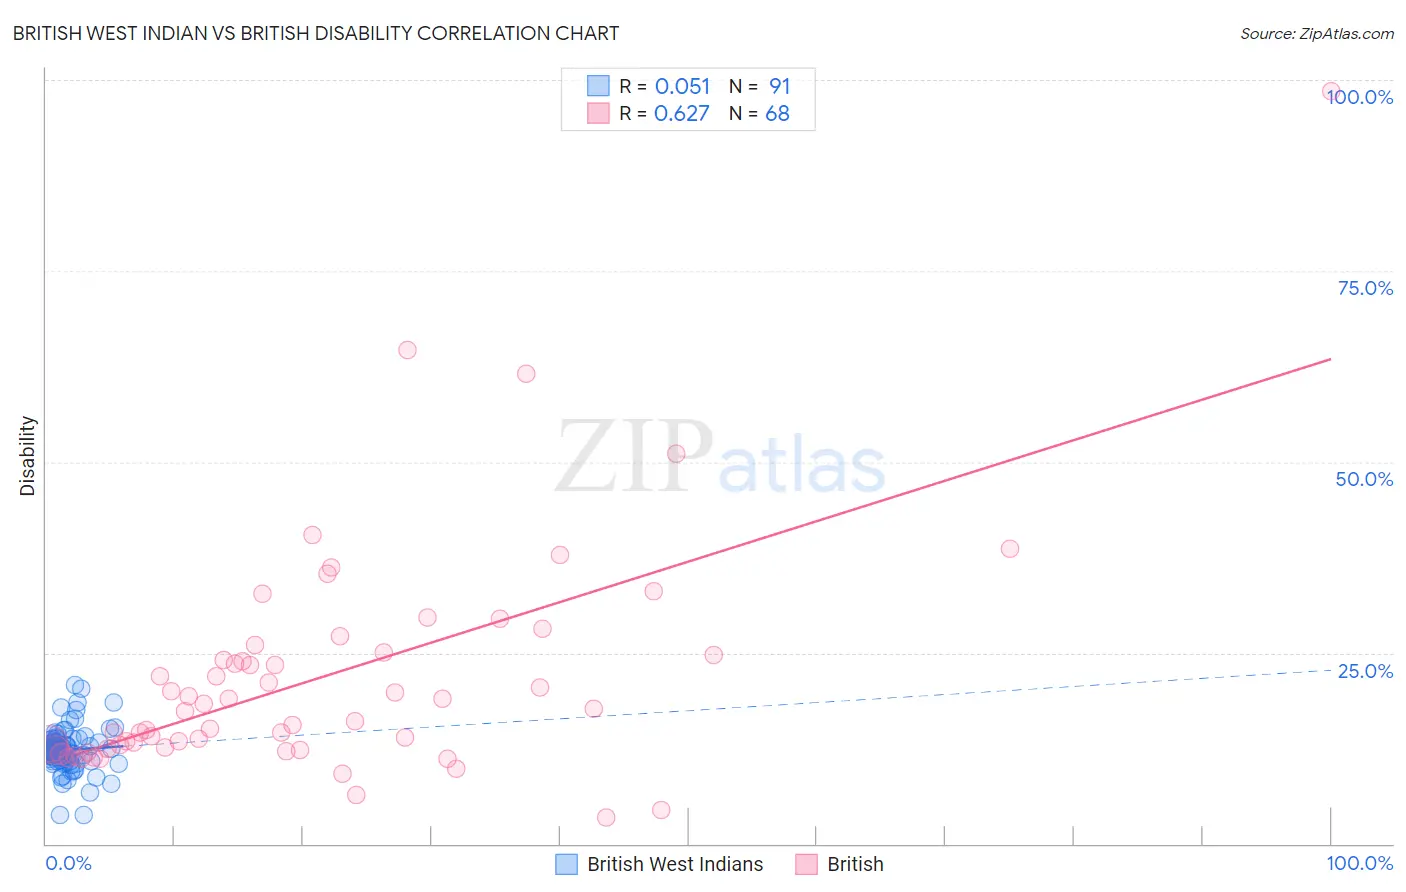
British West Indian vs British Disability Correlation Chart
The statistical analysis conducted on geographies consisting of 152,680,197 people shows a slight positive correlation between the proportion of British West Indians and percentage of population with a disability in the United States with a correlation coefficient (R) of 0.051 and weighted average of 12.0%. Similarly, the statistical analysis conducted on geographies consisting of 531,410,774 people shows a significant positive correlation between the proportion of British and percentage of population with a disability in the United States with a correlation coefficient (R) of 0.627 and weighted average of 12.2%, a difference of 2.3%.
Disability Correlation Summary
| Measurement | British West Indian | British |
| Minimum | 3.7% | 3.5% |
| Maximum | 20.8% | 98.5% |
| Range | 17.1% | 95.0% |
| Mean | 12.3% | 21.7% |
| Median | 12.2% | 17.5% |
| Interquartile 25% (IQ1) | 11.0% | 12.6% |
| Interquartile 75% (IQ3) | 13.3% | 24.8% |
| Interquartile Range (IQR) | 2.3% | 12.3% |
| Standard Deviation (Sample) | 2.8% | 15.1% |
| Standard Deviation (Population) | 2.8% | 15.0% |
Similar Demographics by Disability
Demographics Similar to British West Indians by Disability
In terms of disability, the demographic groups most similar to British West Indians are Mexican American Indian (12.0%, a difference of 0.0%), Immigrants from England (12.0%, a difference of 0.050%), Assyrian/Chaldean/Syriac (11.9%, a difference of 0.12%), Belizean (11.9%, a difference of 0.14%), and Immigrants from Western Europe (12.0%, a difference of 0.16%).
| Demographics | Rating | Rank | Disability |
| Serbians | 15.4 /100 | #196 | Poor 11.9% |
| Immigrants | Belize | 15.2 /100 | #197 | Poor 11.9% |
| Ukrainians | 14.7 /100 | #198 | Poor 11.9% |
| Immigrants | Panama | 14.6 /100 | #199 | Poor 11.9% |
| Belizeans | 12.8 /100 | #200 | Poor 11.9% |
| Assyrians/Chaldeans/Syriacs | 12.6 /100 | #201 | Poor 11.9% |
| Immigrants | England | 12.0 /100 | #202 | Poor 12.0% |
| British West Indians | 11.5 /100 | #203 | Poor 12.0% |
| Mexican American Indians | 11.4 /100 | #204 | Poor 12.0% |
| Immigrants | Western Europe | 10.1 /100 | #205 | Poor 12.0% |
| Immigrants | Senegal | 9.4 /100 | #206 | Tragic 12.0% |
| Immigrants | Thailand | 9.3 /100 | #207 | Tragic 12.0% |
| Immigrants | Caribbean | 9.1 /100 | #208 | Tragic 12.0% |
| Danes | 8.7 /100 | #209 | Tragic 12.0% |
| Czechs | 7.9 /100 | #210 | Tragic 12.0% |
Demographics Similar to British by Disability
In terms of disability, the demographic groups most similar to British are Basque (12.2%, a difference of 0.0%), Liberian (12.2%, a difference of 0.020%), Swiss (12.2%, a difference of 0.040%), Indonesian (12.2%, a difference of 0.070%), and Polish (12.2%, a difference of 0.090%).
| Demographics | Rating | Rank | Disability |
| Chinese | 2.0 /100 | #236 | Tragic 12.2% |
| Immigrants | Congo | 1.9 /100 | #237 | Tragic 12.2% |
| Norwegians | 1.9 /100 | #238 | Tragic 12.2% |
| Swedes | 1.8 /100 | #239 | Tragic 12.2% |
| Hungarians | 1.7 /100 | #240 | Tragic 12.2% |
| Yugoslavians | 1.7 /100 | #241 | Tragic 12.2% |
| Poles | 1.7 /100 | #242 | Tragic 12.2% |
| British | 1.5 /100 | #243 | Tragic 12.2% |
| Basques | 1.5 /100 | #244 | Tragic 12.2% |
| Liberians | 1.5 /100 | #245 | Tragic 12.2% |
| Swiss | 1.5 /100 | #246 | Tragic 12.2% |
| Indonesians | 1.4 /100 | #247 | Tragic 12.2% |
| Guamanians/Chamorros | 1.4 /100 | #248 | Tragic 12.3% |
| Carpatho Rusyns | 1.4 /100 | #249 | Tragic 12.3% |
| Sub-Saharan Africans | 1.4 /100 | #250 | Tragic 12.3% |