Tongan vs British Disability
COMPARE
Tongan
British
Disability
Disability Comparison
Tongans
British
10.8%
DISABILITY
99.9/ 100
METRIC RATING
46th/ 347
METRIC RANK
12.2%
DISABILITY
1.5/ 100
METRIC RATING
243rd/ 347
METRIC RANK
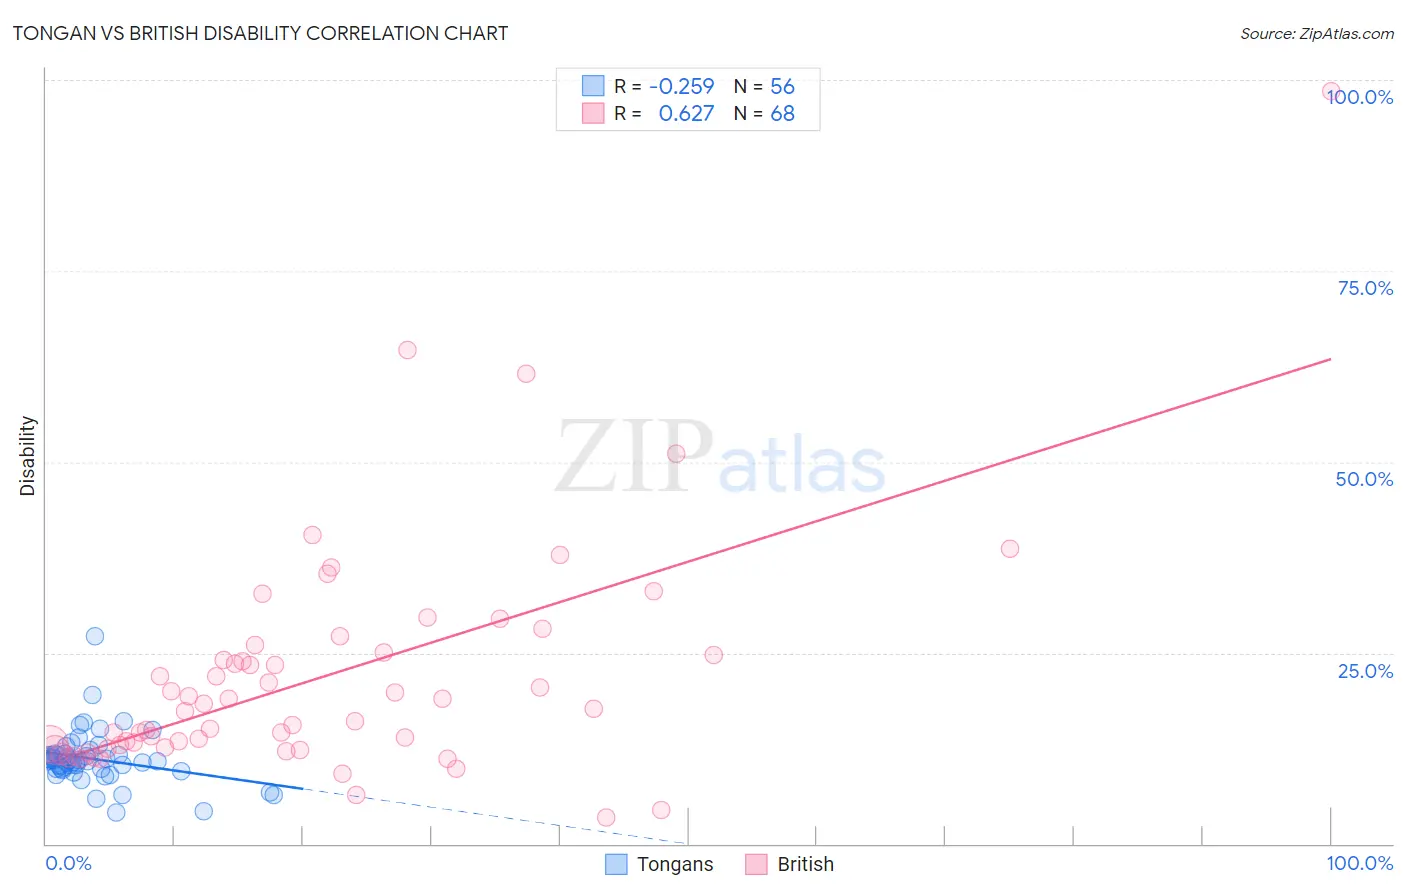
Tongan vs British Disability Correlation Chart
The statistical analysis conducted on geographies consisting of 102,894,634 people shows a weak negative correlation between the proportion of Tongans and percentage of population with a disability in the United States with a correlation coefficient (R) of -0.259 and weighted average of 10.8%. Similarly, the statistical analysis conducted on geographies consisting of 531,410,774 people shows a significant positive correlation between the proportion of British and percentage of population with a disability in the United States with a correlation coefficient (R) of 0.627 and weighted average of 12.2%, a difference of 13.0%.
Disability Correlation Summary
| Measurement | Tongan | British |
| Minimum | 4.2% | 3.5% |
| Maximum | 27.1% | 98.5% |
| Range | 23.0% | 95.0% |
| Mean | 11.1% | 21.7% |
| Median | 10.8% | 17.5% |
| Interquartile 25% (IQ1) | 9.8% | 12.6% |
| Interquartile 75% (IQ3) | 11.7% | 24.8% |
| Interquartile Range (IQR) | 1.9% | 12.3% |
| Standard Deviation (Sample) | 3.5% | 15.1% |
| Standard Deviation (Population) | 3.5% | 15.0% |
Similar Demographics by Disability
Demographics Similar to Tongans by Disability
In terms of disability, the demographic groups most similar to Tongans are Immigrants from Peru (10.8%, a difference of 0.010%), Taiwanese (10.8%, a difference of 0.010%), Soviet Union (10.9%, a difference of 0.20%), Vietnamese (10.9%, a difference of 0.26%), and Immigrants from Saudi Arabia (10.9%, a difference of 0.26%).
| Demographics | Rating | Rank | Disability |
| Cambodians | 99.9 /100 | #39 | Exceptional 10.8% |
| Mongolians | 99.9 /100 | #40 | Exceptional 10.8% |
| Immigrants | Australia | 99.9 /100 | #41 | Exceptional 10.8% |
| Immigrants | Nepal | 99.9 /100 | #42 | Exceptional 10.8% |
| Israelis | 99.9 /100 | #43 | Exceptional 10.8% |
| Immigrants | Japan | 99.9 /100 | #44 | Exceptional 10.8% |
| Immigrants | Peru | 99.9 /100 | #45 | Exceptional 10.8% |
| Tongans | 99.9 /100 | #46 | Exceptional 10.8% |
| Taiwanese | 99.9 /100 | #47 | Exceptional 10.8% |
| Soviet Union | 99.9 /100 | #48 | Exceptional 10.9% |
| Vietnamese | 99.9 /100 | #49 | Exceptional 10.9% |
| Immigrants | Saudi Arabia | 99.9 /100 | #50 | Exceptional 10.9% |
| Peruvians | 99.8 /100 | #51 | Exceptional 10.9% |
| South Americans | 99.8 /100 | #52 | Exceptional 10.9% |
| Immigrants | Spain | 99.8 /100 | #53 | Exceptional 10.9% |
Demographics Similar to British by Disability
In terms of disability, the demographic groups most similar to British are Basque (12.2%, a difference of 0.0%), Liberian (12.2%, a difference of 0.020%), Swiss (12.2%, a difference of 0.040%), Indonesian (12.2%, a difference of 0.070%), and Polish (12.2%, a difference of 0.090%).
| Demographics | Rating | Rank | Disability |
| Chinese | 2.0 /100 | #236 | Tragic 12.2% |
| Immigrants | Congo | 1.9 /100 | #237 | Tragic 12.2% |
| Norwegians | 1.9 /100 | #238 | Tragic 12.2% |
| Swedes | 1.8 /100 | #239 | Tragic 12.2% |
| Hungarians | 1.7 /100 | #240 | Tragic 12.2% |
| Yugoslavians | 1.7 /100 | #241 | Tragic 12.2% |
| Poles | 1.7 /100 | #242 | Tragic 12.2% |
| British | 1.5 /100 | #243 | Tragic 12.2% |
| Basques | 1.5 /100 | #244 | Tragic 12.2% |
| Liberians | 1.5 /100 | #245 | Tragic 12.2% |
| Swiss | 1.5 /100 | #246 | Tragic 12.2% |
| Indonesians | 1.4 /100 | #247 | Tragic 12.2% |
| Guamanians/Chamorros | 1.4 /100 | #248 | Tragic 12.3% |
| Carpatho Rusyns | 1.4 /100 | #249 | Tragic 12.3% |
| Sub-Saharan Africans | 1.4 /100 | #250 | Tragic 12.3% |