Jamaican vs Armenian Currently Married
COMPARE
Jamaican
Armenian
Currently Married
Currently Married Comparison
Jamaicans
Armenians
41.4%
CURRENTLY MARRIED
0.0/ 100
METRIC RATING
313th/ 347
METRIC RANK
46.8%
CURRENTLY MARRIED
58.2/ 100
METRIC RATING
169th/ 347
METRIC RANK
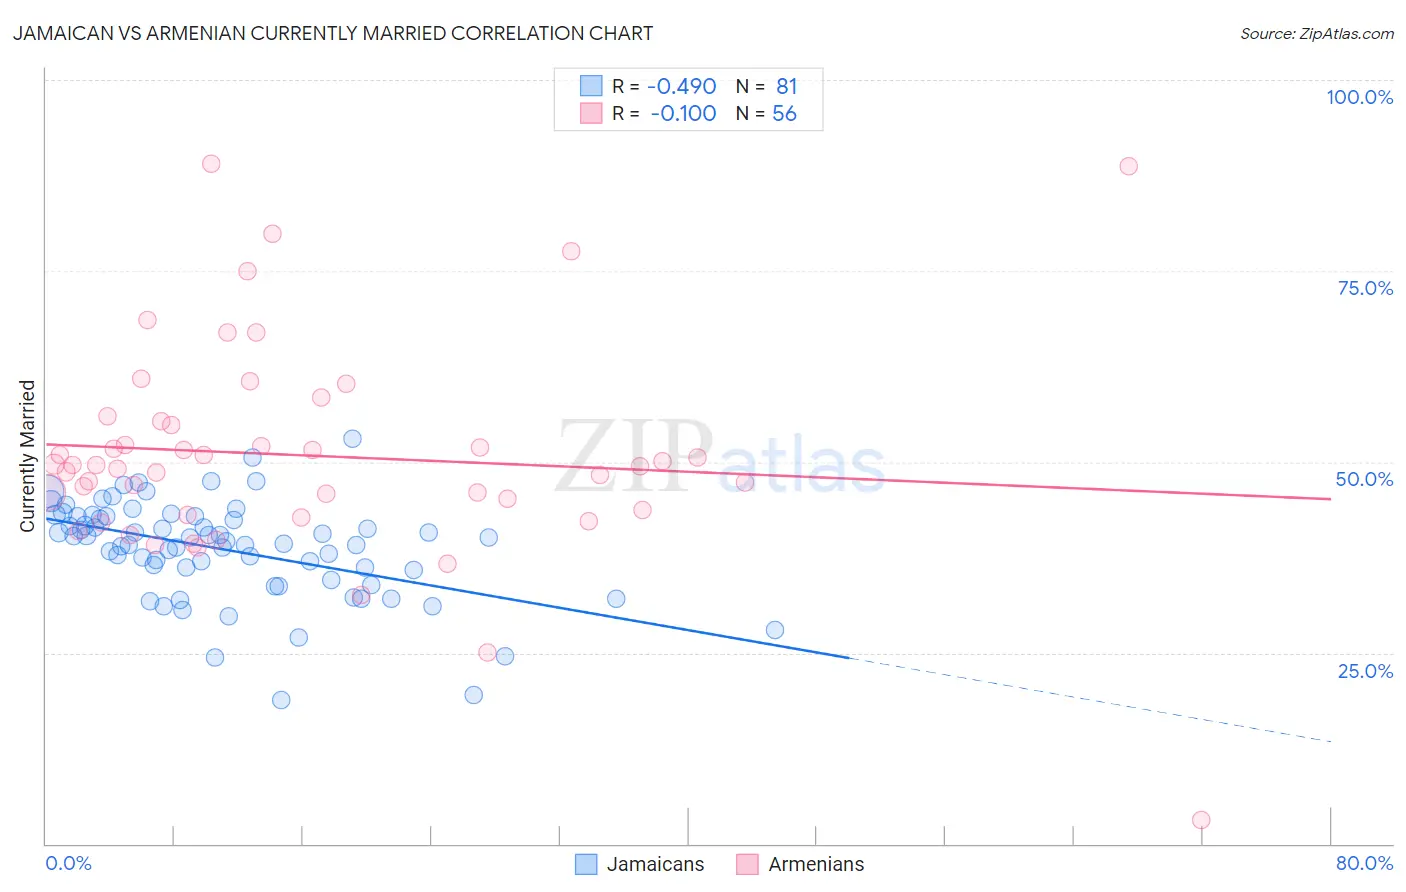
Jamaican vs Armenian Currently Married Correlation Chart
The statistical analysis conducted on geographies consisting of 368,004,365 people shows a moderate negative correlation between the proportion of Jamaicans and percentage of population currently married in the United States with a correlation coefficient (R) of -0.490 and weighted average of 41.4%. Similarly, the statistical analysis conducted on geographies consisting of 310,938,926 people shows a poor negative correlation between the proportion of Armenians and percentage of population currently married in the United States with a correlation coefficient (R) of -0.100 and weighted average of 46.8%, a difference of 13.1%.
Currently Married Correlation Summary
| Measurement | Jamaican | Armenian |
| Minimum | 18.8% | 3.1% |
| Maximum | 53.1% | 89.1% |
| Range | 34.3% | 86.0% |
| Mean | 38.5% | 50.8% |
| Median | 39.6% | 49.5% |
| Interquartile 25% (IQ1) | 35.2% | 43.4% |
| Interquartile 75% (IQ3) | 42.9% | 55.1% |
| Interquartile Range (IQR) | 7.6% | 11.7% |
| Standard Deviation (Sample) | 6.4% | 14.2% |
| Standard Deviation (Population) | 6.4% | 14.0% |
Similar Demographics by Currently Married
Demographics Similar to Jamaicans by Currently Married
In terms of currently married, the demographic groups most similar to Jamaicans are West Indian (41.3%, a difference of 0.080%), Inupiat (41.3%, a difference of 0.16%), Immigrants from Caribbean (41.3%, a difference of 0.22%), Haitian (41.3%, a difference of 0.24%), and Somali (41.5%, a difference of 0.29%).
| Demographics | Rating | Rank | Currently Married |
| Immigrants | Guyana | 0.0 /100 | #306 | Tragic 41.9% |
| Africans | 0.0 /100 | #307 | Tragic 41.8% |
| Immigrants | Belize | 0.0 /100 | #308 | Tragic 41.8% |
| Immigrants | Liberia | 0.0 /100 | #309 | Tragic 41.8% |
| Guyanese | 0.0 /100 | #310 | Tragic 41.6% |
| Trinidadians and Tobagonians | 0.0 /100 | #311 | Tragic 41.5% |
| Somalis | 0.0 /100 | #312 | Tragic 41.5% |
| Jamaicans | 0.0 /100 | #313 | Tragic 41.4% |
| West Indians | 0.0 /100 | #314 | Tragic 41.3% |
| Inupiat | 0.0 /100 | #315 | Tragic 41.3% |
| Immigrants | Caribbean | 0.0 /100 | #316 | Tragic 41.3% |
| Haitians | 0.0 /100 | #317 | Tragic 41.3% |
| Bahamians | 0.0 /100 | #318 | Tragic 41.2% |
| Immigrants | Somalia | 0.0 /100 | #319 | Tragic 41.2% |
| Immigrants | Jamaica | 0.0 /100 | #320 | Tragic 41.1% |
Demographics Similar to Armenians by Currently Married
In terms of currently married, the demographic groups most similar to Armenians are Immigrants from Afghanistan (46.8%, a difference of 0.0%), Spaniard (46.8%, a difference of 0.020%), Immigrants from Syria (46.8%, a difference of 0.040%), Immigrants from Latvia (46.7%, a difference of 0.050%), and Samoan (46.8%, a difference of 0.060%).
| Demographics | Rating | Rank | Currently Married |
| Immigrants | Nonimmigrants | 65.4 /100 | #162 | Good 46.9% |
| Delaware | 64.7 /100 | #163 | Good 46.9% |
| Immigrants | Western Asia | 64.2 /100 | #164 | Good 46.9% |
| Samoans | 59.8 /100 | #165 | Average 46.8% |
| Immigrants | Syria | 59.3 /100 | #166 | Average 46.8% |
| Spaniards | 58.8 /100 | #167 | Average 46.8% |
| Immigrants | Afghanistan | 58.2 /100 | #168 | Average 46.8% |
| Armenians | 58.2 /100 | #169 | Average 46.8% |
| Immigrants | Latvia | 56.7 /100 | #170 | Average 46.7% |
| Immigrants | Zimbabwe | 52.4 /100 | #171 | Average 46.7% |
| Aleuts | 52.0 /100 | #172 | Average 46.7% |
| Tlingit-Haida | 51.2 /100 | #173 | Average 46.7% |
| Peruvians | 50.0 /100 | #174 | Average 46.6% |
| Immigrants | Brazil | 49.9 /100 | #175 | Average 46.6% |
| Hawaiians | 48.6 /100 | #176 | Average 46.6% |