Immigrants from Cameroon vs Armenian Disability
COMPARE
Immigrants from Cameroon
Armenian
Disability
Disability Comparison
Immigrants from Cameroon
Armenians
11.1%
DISABILITY
99.3/ 100
METRIC RATING
78th/ 347
METRIC RANK
11.6%
DISABILITY
65.9/ 100
METRIC RATING
158th/ 347
METRIC RANK
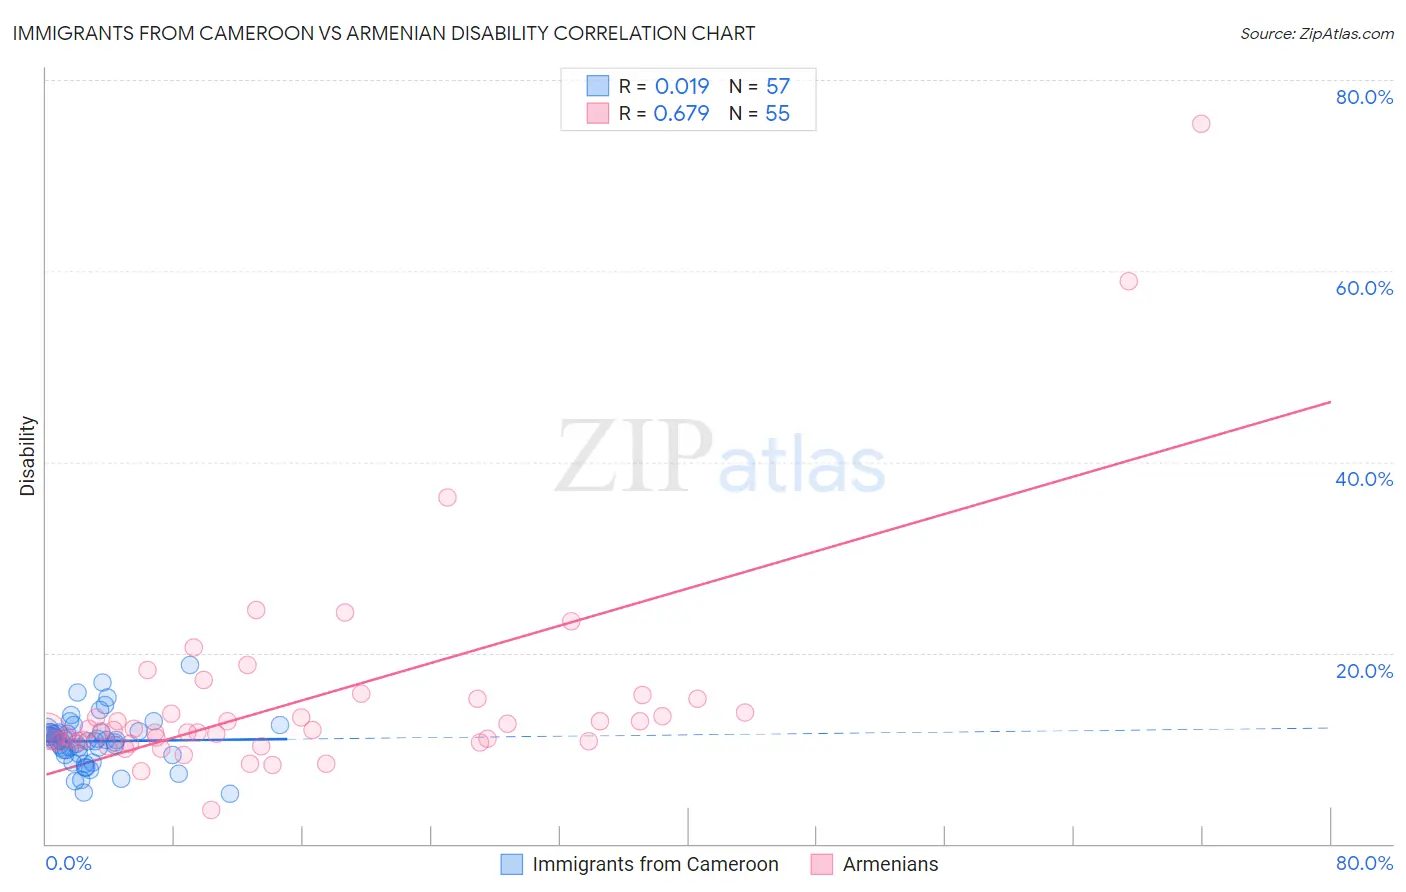
Immigrants from Cameroon vs Armenian Disability Correlation Chart
The statistical analysis conducted on geographies consisting of 130,761,235 people shows no correlation between the proportion of Immigrants from Cameroon and percentage of population with a disability in the United States with a correlation coefficient (R) of 0.019 and weighted average of 11.1%. Similarly, the statistical analysis conducted on geographies consisting of 310,943,195 people shows a significant positive correlation between the proportion of Armenians and percentage of population with a disability in the United States with a correlation coefficient (R) of 0.679 and weighted average of 11.6%, a difference of 5.1%.
Disability Correlation Summary
| Measurement | Immigrants from Cameroon | Armenian |
| Minimum | 5.2% | 3.6% |
| Maximum | 18.7% | 75.4% |
| Range | 13.5% | 71.8% |
| Mean | 10.7% | 15.1% |
| Median | 10.8% | 11.9% |
| Interquartile 25% (IQ1) | 9.4% | 10.7% |
| Interquartile 75% (IQ3) | 11.6% | 15.1% |
| Interquartile Range (IQR) | 2.3% | 4.4% |
| Standard Deviation (Sample) | 2.6% | 11.5% |
| Standard Deviation (Population) | 2.6% | 11.4% |
Similar Demographics by Disability
Demographics Similar to Immigrants from Cameroon by Disability
In terms of disability, the demographic groups most similar to Immigrants from Cameroon are Sierra Leonean (11.0%, a difference of 0.040%), Immigrants from Belgium (11.0%, a difference of 0.040%), Immigrants from Jordan (11.1%, a difference of 0.040%), Immigrants from Vietnam (11.0%, a difference of 0.070%), and Immigrants from Ireland (11.1%, a difference of 0.080%).
| Demographics | Rating | Rank | Disability |
| Immigrants | Lebanon | 99.4 /100 | #71 | Exceptional 11.0% |
| Immigrants | Chile | 99.4 /100 | #72 | Exceptional 11.0% |
| Immigrants | Bangladesh | 99.4 /100 | #73 | Exceptional 11.0% |
| Immigrants | Serbia | 99.4 /100 | #74 | Exceptional 11.0% |
| Immigrants | Vietnam | 99.4 /100 | #75 | Exceptional 11.0% |
| Sierra Leoneans | 99.3 /100 | #76 | Exceptional 11.0% |
| Immigrants | Belgium | 99.3 /100 | #77 | Exceptional 11.0% |
| Immigrants | Cameroon | 99.3 /100 | #78 | Exceptional 11.1% |
| Immigrants | Jordan | 99.3 /100 | #79 | Exceptional 11.1% |
| Immigrants | Ireland | 99.3 /100 | #80 | Exceptional 11.1% |
| Immigrants | Poland | 99.1 /100 | #81 | Exceptional 11.1% |
| Chileans | 99.1 /100 | #82 | Exceptional 11.1% |
| Immigrants | Switzerland | 99.0 /100 | #83 | Exceptional 11.1% |
| Immigrants | Sierra Leone | 99.0 /100 | #84 | Exceptional 11.1% |
| Immigrants | Belarus | 98.9 /100 | #85 | Exceptional 11.1% |
Demographics Similar to Armenians by Disability
In terms of disability, the demographic groups most similar to Armenians are Guatemalan (11.6%, a difference of 0.040%), Immigrants from Barbados (11.6%, a difference of 0.080%), Immigrants from Cuba (11.6%, a difference of 0.15%), Immigrants from Middle Africa (11.6%, a difference of 0.18%), and Immigrants from Fiji (11.6%, a difference of 0.19%).
| Demographics | Rating | Rank | Disability |
| Immigrants | Kenya | 72.1 /100 | #151 | Good 11.6% |
| Immigrants | Moldova | 72.0 /100 | #152 | Good 11.6% |
| Immigrants | Ghana | 71.2 /100 | #153 | Good 11.6% |
| Immigrants | Guatemala | 71.1 /100 | #154 | Good 11.6% |
| Immigrants | Netherlands | 69.8 /100 | #155 | Good 11.6% |
| Immigrants | Fiji | 69.5 /100 | #156 | Good 11.6% |
| Immigrants | Middle Africa | 69.5 /100 | #157 | Good 11.6% |
| Armenians | 65.9 /100 | #158 | Good 11.6% |
| Guatemalans | 65.1 /100 | #159 | Good 11.6% |
| Immigrants | Barbados | 64.2 /100 | #160 | Good 11.6% |
| Immigrants | Cuba | 62.8 /100 | #161 | Good 11.6% |
| Immigrants | Haiti | 59.2 /100 | #162 | Average 11.7% |
| Immigrants | Trinidad and Tobago | 58.9 /100 | #163 | Average 11.7% |
| Syrians | 58.5 /100 | #164 | Average 11.7% |
| Cubans | 56.7 /100 | #165 | Average 11.7% |