Mexican American Indian vs Armenian Disability
COMPARE
Mexican American Indian
Armenian
Disability
Disability Comparison
Mexican American Indians
Armenians
12.0%
DISABILITY
11.4/ 100
METRIC RATING
204th/ 347
METRIC RANK
11.6%
DISABILITY
65.9/ 100
METRIC RATING
158th/ 347
METRIC RANK
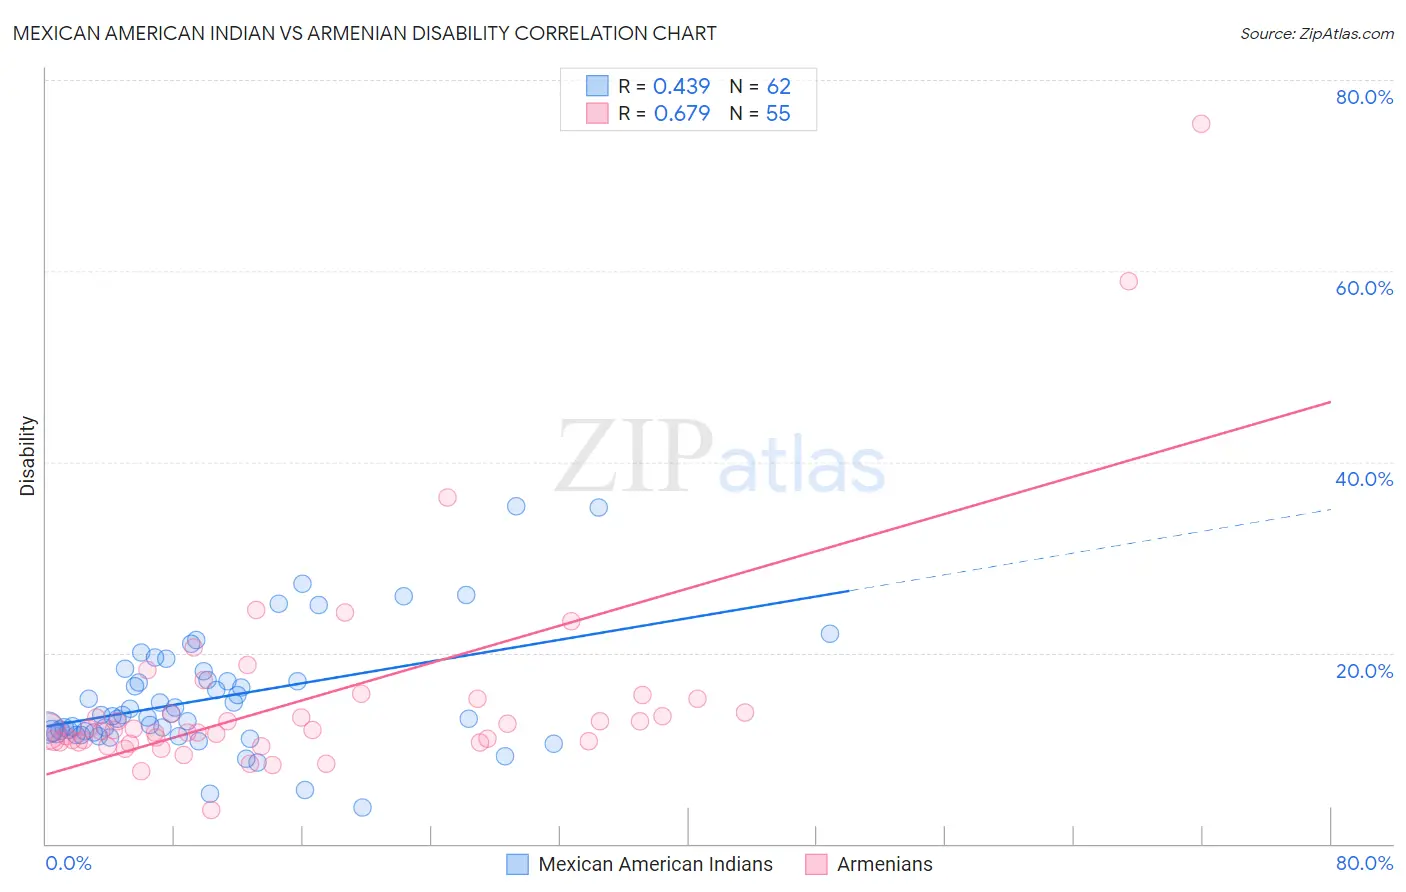
Mexican American Indian vs Armenian Disability Correlation Chart
The statistical analysis conducted on geographies consisting of 317,572,347 people shows a moderate positive correlation between the proportion of Mexican American Indians and percentage of population with a disability in the United States with a correlation coefficient (R) of 0.439 and weighted average of 12.0%. Similarly, the statistical analysis conducted on geographies consisting of 310,943,195 people shows a significant positive correlation between the proportion of Armenians and percentage of population with a disability in the United States with a correlation coefficient (R) of 0.679 and weighted average of 11.6%, a difference of 3.0%.
Disability Correlation Summary
| Measurement | Mexican American Indian | Armenian |
| Minimum | 3.8% | 3.6% |
| Maximum | 35.4% | 75.4% |
| Range | 31.6% | 71.8% |
| Mean | 15.3% | 15.1% |
| Median | 13.4% | 11.9% |
| Interquartile 25% (IQ1) | 11.6% | 10.7% |
| Interquartile 75% (IQ3) | 17.2% | 15.1% |
| Interquartile Range (IQR) | 5.6% | 4.4% |
| Standard Deviation (Sample) | 6.2% | 11.5% |
| Standard Deviation (Population) | 6.1% | 11.4% |
Similar Demographics by Disability
Demographics Similar to Mexican American Indians by Disability
In terms of disability, the demographic groups most similar to Mexican American Indians are British West Indian (12.0%, a difference of 0.0%), Immigrants from England (12.0%, a difference of 0.050%), Assyrian/Chaldean/Syriac (11.9%, a difference of 0.12%), Belizean (11.9%, a difference of 0.14%), and Immigrants from Western Europe (12.0%, a difference of 0.16%).
| Demographics | Rating | Rank | Disability |
| Immigrants | Belize | 15.2 /100 | #197 | Poor 11.9% |
| Ukrainians | 14.7 /100 | #198 | Poor 11.9% |
| Immigrants | Panama | 14.6 /100 | #199 | Poor 11.9% |
| Belizeans | 12.8 /100 | #200 | Poor 11.9% |
| Assyrians/Chaldeans/Syriacs | 12.6 /100 | #201 | Poor 11.9% |
| Immigrants | England | 12.0 /100 | #202 | Poor 12.0% |
| British West Indians | 11.5 /100 | #203 | Poor 12.0% |
| Mexican American Indians | 11.4 /100 | #204 | Poor 12.0% |
| Immigrants | Western Europe | 10.1 /100 | #205 | Poor 12.0% |
| Immigrants | Senegal | 9.4 /100 | #206 | Tragic 12.0% |
| Immigrants | Thailand | 9.3 /100 | #207 | Tragic 12.0% |
| Immigrants | Caribbean | 9.1 /100 | #208 | Tragic 12.0% |
| Danes | 8.7 /100 | #209 | Tragic 12.0% |
| Czechs | 7.9 /100 | #210 | Tragic 12.0% |
| Immigrants | Cambodia | 7.3 /100 | #211 | Tragic 12.0% |
Demographics Similar to Armenians by Disability
In terms of disability, the demographic groups most similar to Armenians are Guatemalan (11.6%, a difference of 0.040%), Immigrants from Barbados (11.6%, a difference of 0.080%), Immigrants from Cuba (11.6%, a difference of 0.15%), Immigrants from Middle Africa (11.6%, a difference of 0.18%), and Immigrants from Fiji (11.6%, a difference of 0.19%).
| Demographics | Rating | Rank | Disability |
| Immigrants | Kenya | 72.1 /100 | #151 | Good 11.6% |
| Immigrants | Moldova | 72.0 /100 | #152 | Good 11.6% |
| Immigrants | Ghana | 71.2 /100 | #153 | Good 11.6% |
| Immigrants | Guatemala | 71.1 /100 | #154 | Good 11.6% |
| Immigrants | Netherlands | 69.8 /100 | #155 | Good 11.6% |
| Immigrants | Fiji | 69.5 /100 | #156 | Good 11.6% |
| Immigrants | Middle Africa | 69.5 /100 | #157 | Good 11.6% |
| Armenians | 65.9 /100 | #158 | Good 11.6% |
| Guatemalans | 65.1 /100 | #159 | Good 11.6% |
| Immigrants | Barbados | 64.2 /100 | #160 | Good 11.6% |
| Immigrants | Cuba | 62.8 /100 | #161 | Good 11.6% |
| Immigrants | Haiti | 59.2 /100 | #162 | Average 11.7% |
| Immigrants | Trinidad and Tobago | 58.9 /100 | #163 | Average 11.7% |
| Syrians | 58.5 /100 | #164 | Average 11.7% |
| Cubans | 56.7 /100 | #165 | Average 11.7% |