American vs Creek Disability Age Under 5
COMPARE
American
Creek
Disability Age Under 5
Disability Age Under 5 Comparison
Americans
Creek
1.9%
DISABILITY AGE UNDER 5
0.0/ 100
METRIC RATING
328th/ 347
METRIC RANK
1.6%
DISABILITY AGE UNDER 5
0.0/ 100
METRIC RATING
306th/ 347
METRIC RANK
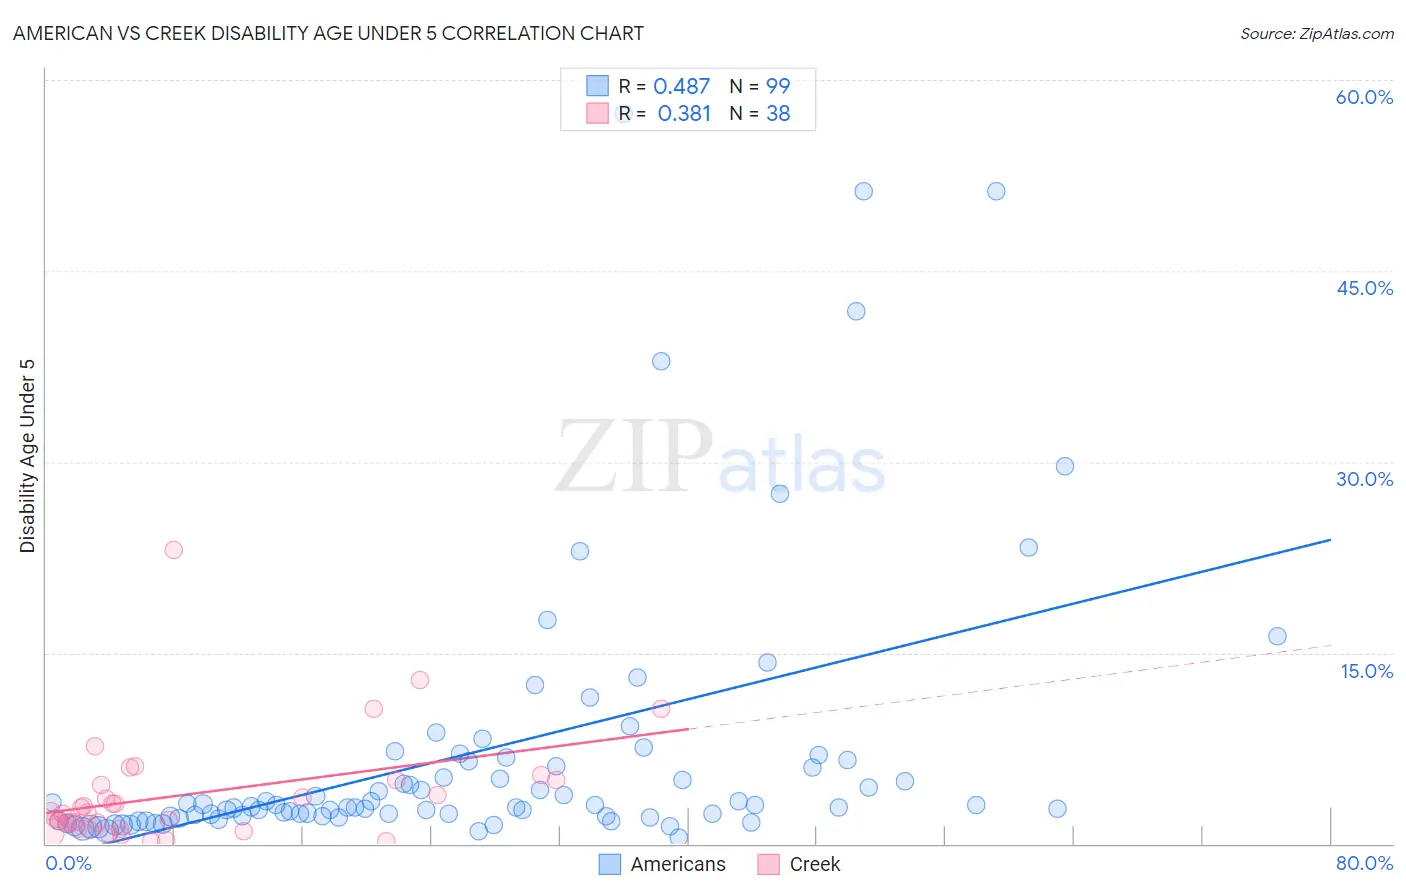
American vs Creek Disability Age Under 5 Correlation Chart
The statistical analysis conducted on geographies consisting of 262,372,368 people shows a moderate positive correlation between the proportion of Americans and percentage of population with a disability under the age of 5 in the United States with a correlation coefficient (R) of 0.487 and weighted average of 1.9%. Similarly, the statistical analysis conducted on geographies consisting of 124,448,174 people shows a mild positive correlation between the proportion of Creek and percentage of population with a disability under the age of 5 in the United States with a correlation coefficient (R) of 0.381 and weighted average of 1.6%, a difference of 12.9%.
Disability Age Under 5 Correlation Summary
| Measurement | American | Creek |
| Minimum | 0.45% | 0.21% |
| Maximum | 57.3% | 23.1% |
| Range | 56.8% | 22.9% |
| Mean | 7.1% | 3.9% |
| Median | 2.9% | 2.5% |
| Interquartile 25% (IQ1) | 2.1% | 1.2% |
| Interquartile 75% (IQ3) | 6.5% | 5.0% |
| Interquartile Range (IQR) | 4.3% | 3.8% |
| Standard Deviation (Sample) | 11.0% | 4.4% |
| Standard Deviation (Population) | 11.0% | 4.3% |
Similar Demographics by Disability Age Under 5
Demographics Similar to Americans by Disability Age Under 5
In terms of disability age under 5, the demographic groups most similar to Americans are Houma (1.9%, a difference of 0.47%), Choctaw (1.9%, a difference of 0.80%), French Canadian (1.9%, a difference of 1.1%), Chippewa (1.9%, a difference of 1.2%), and Osage (1.8%, a difference of 1.7%).
| Demographics | Rating | Rank | Disability Age Under 5 |
| Ottawa | 0.0 /100 | #321 | Tragic 1.7% |
| Germans | 0.0 /100 | #322 | Tragic 1.7% |
| Chickasaw | 0.0 /100 | #323 | Tragic 1.7% |
| Cherokee | 0.0 /100 | #324 | Tragic 1.8% |
| Immigrants | Portugal | 0.0 /100 | #325 | Tragic 1.8% |
| Sioux | 0.0 /100 | #326 | Tragic 1.8% |
| Osage | 0.0 /100 | #327 | Tragic 1.8% |
| Americans | 0.0 /100 | #328 | Tragic 1.9% |
| Houma | 0.0 /100 | #329 | Tragic 1.9% |
| Choctaw | 0.0 /100 | #330 | Tragic 1.9% |
| French Canadians | 0.0 /100 | #331 | Tragic 1.9% |
| Chippewa | 0.0 /100 | #332 | Tragic 1.9% |
| Dutch West Indians | 0.0 /100 | #333 | Tragic 1.9% |
| Natives/Alaskans | 0.0 /100 | #334 | Tragic 1.9% |
| Pennsylvania Germans | 0.0 /100 | #335 | Tragic 1.9% |
Demographics Similar to Creek by Disability Age Under 5
In terms of disability age under 5, the demographic groups most similar to Creek are Blackfeet (1.6%, a difference of 0.040%), Scottish (1.6%, a difference of 0.070%), Seminole (1.6%, a difference of 0.19%), Navajo (1.6%, a difference of 0.21%), and Swiss (1.6%, a difference of 0.83%).
| Demographics | Rating | Rank | Disability Age Under 5 |
| Portuguese | 0.0 /100 | #299 | Tragic 1.6% |
| Shoshone | 0.0 /100 | #300 | Tragic 1.6% |
| German Russians | 0.0 /100 | #301 | Tragic 1.6% |
| Welsh | 0.0 /100 | #302 | Tragic 1.6% |
| Swiss | 0.0 /100 | #303 | Tragic 1.6% |
| Seminole | 0.0 /100 | #304 | Tragic 1.6% |
| Blackfeet | 0.0 /100 | #305 | Tragic 1.6% |
| Creek | 0.0 /100 | #306 | Tragic 1.6% |
| Scottish | 0.0 /100 | #307 | Tragic 1.6% |
| Navajo | 0.0 /100 | #308 | Tragic 1.6% |
| Cape Verdeans | 0.0 /100 | #309 | Tragic 1.7% |
| Whites/Caucasians | 0.0 /100 | #310 | Tragic 1.7% |
| English | 0.0 /100 | #311 | Tragic 1.7% |
| Puerto Ricans | 0.0 /100 | #312 | Tragic 1.7% |
| Celtics | 0.0 /100 | #313 | Tragic 1.7% |