Immigrants from Zaire vs Creek Disability Age Under 5
COMPARE
Immigrants from Zaire
Creek
Disability Age Under 5
Disability Age Under 5 Comparison
Immigrants from Zaire
Creek
1.1%
DISABILITY AGE UNDER 5
97.8/ 100
METRIC RATING
84th/ 347
METRIC RANK
1.6%
DISABILITY AGE UNDER 5
0.0/ 100
METRIC RATING
306th/ 347
METRIC RANK
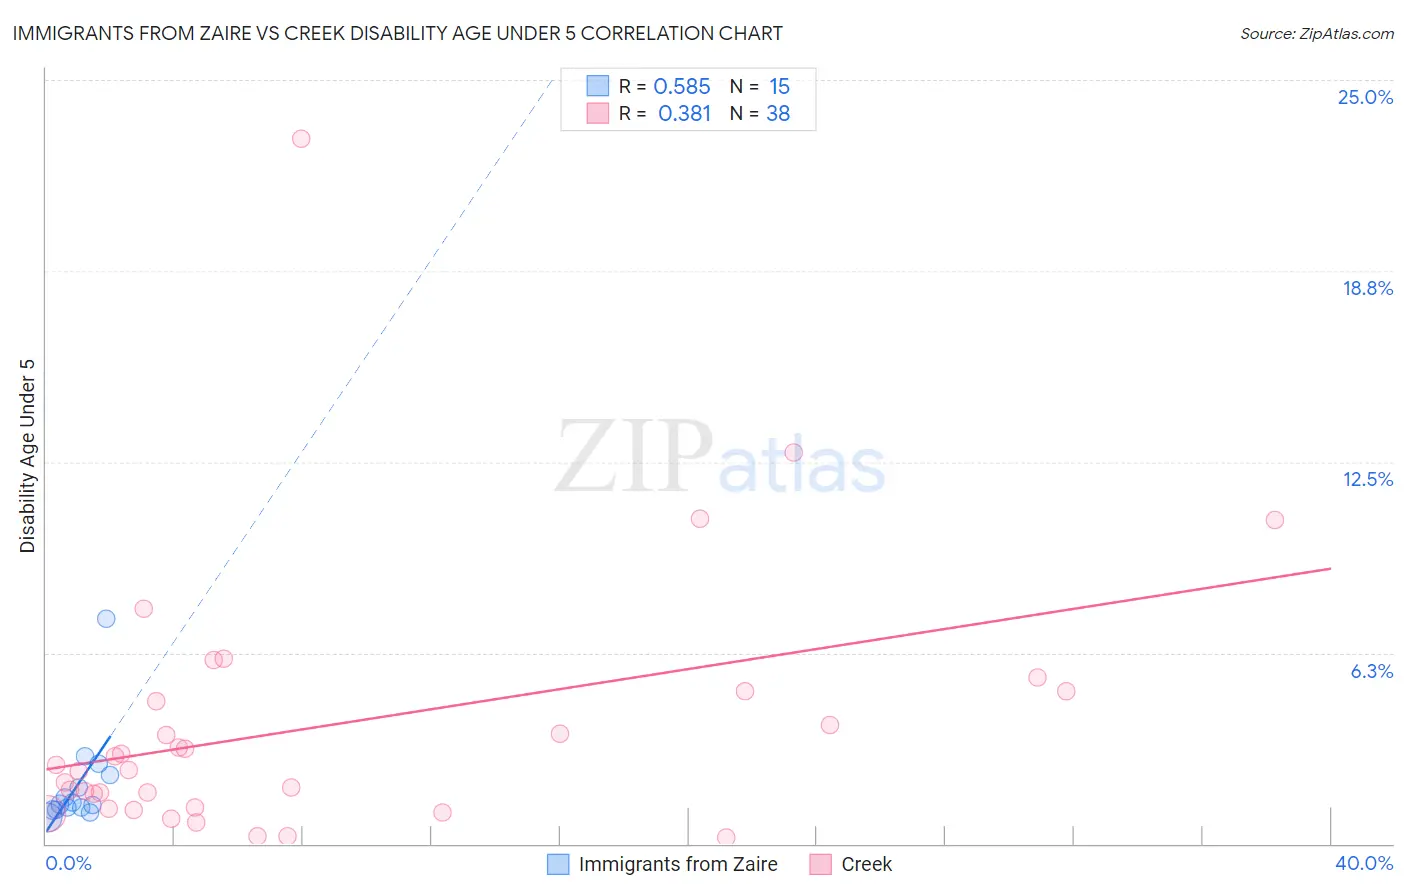
Immigrants from Zaire vs Creek Disability Age Under 5 Correlation Chart
The statistical analysis conducted on geographies consisting of 82,804,930 people shows a substantial positive correlation between the proportion of Immigrants from Zaire and percentage of population with a disability under the age of 5 in the United States with a correlation coefficient (R) of 0.585 and weighted average of 1.1%. Similarly, the statistical analysis conducted on geographies consisting of 124,448,174 people shows a mild positive correlation between the proportion of Creek and percentage of population with a disability under the age of 5 in the United States with a correlation coefficient (R) of 0.381 and weighted average of 1.6%, a difference of 45.1%.
Disability Age Under 5 Correlation Summary
| Measurement | Immigrants from Zaire | Creek |
| Minimum | 0.85% | 0.21% |
| Maximum | 7.4% | 23.1% |
| Range | 6.5% | 22.9% |
| Mean | 1.9% | 3.9% |
| Median | 1.3% | 2.5% |
| Interquartile 25% (IQ1) | 1.1% | 1.2% |
| Interquartile 75% (IQ3) | 2.3% | 5.0% |
| Interquartile Range (IQR) | 1.2% | 3.8% |
| Standard Deviation (Sample) | 1.6% | 4.4% |
| Standard Deviation (Population) | 1.6% | 4.3% |
Similar Demographics by Disability Age Under 5
Demographics Similar to Immigrants from Zaire by Disability Age Under 5
In terms of disability age under 5, the demographic groups most similar to Immigrants from Zaire are Sudanese (1.1%, a difference of 0.080%), Immigrants from Syria (1.1%, a difference of 0.15%), Immigrants from Jordan (1.1%, a difference of 0.16%), Okinawan (1.1%, a difference of 0.20%), and Ugandan (1.1%, a difference of 0.22%).
| Demographics | Rating | Rank | Disability Age Under 5 |
| Immigrants | Denmark | 98.1 /100 | #77 | Exceptional 1.1% |
| West Indians | 98.0 /100 | #78 | Exceptional 1.1% |
| Hmong | 98.0 /100 | #79 | Exceptional 1.1% |
| Immigrants | Trinidad and Tobago | 98.0 /100 | #80 | Exceptional 1.1% |
| Turks | 98.0 /100 | #81 | Exceptional 1.1% |
| Immigrants | Jordan | 97.9 /100 | #82 | Exceptional 1.1% |
| Immigrants | Syria | 97.9 /100 | #83 | Exceptional 1.1% |
| Immigrants | Zaire | 97.8 /100 | #84 | Exceptional 1.1% |
| Sudanese | 97.7 /100 | #85 | Exceptional 1.1% |
| Okinawans | 97.6 /100 | #86 | Exceptional 1.1% |
| Ugandans | 97.5 /100 | #87 | Exceptional 1.1% |
| Immigrants | Dominican Republic | 97.5 /100 | #88 | Exceptional 1.1% |
| Ethiopians | 97.2 /100 | #89 | Exceptional 1.1% |
| Chinese | 97.2 /100 | #90 | Exceptional 1.1% |
| Albanians | 97.2 /100 | #91 | Exceptional 1.1% |
Demographics Similar to Creek by Disability Age Under 5
In terms of disability age under 5, the demographic groups most similar to Creek are Blackfeet (1.6%, a difference of 0.040%), Scottish (1.6%, a difference of 0.070%), Seminole (1.6%, a difference of 0.19%), Navajo (1.6%, a difference of 0.21%), and Swiss (1.6%, a difference of 0.83%).
| Demographics | Rating | Rank | Disability Age Under 5 |
| Portuguese | 0.0 /100 | #299 | Tragic 1.6% |
| Shoshone | 0.0 /100 | #300 | Tragic 1.6% |
| German Russians | 0.0 /100 | #301 | Tragic 1.6% |
| Welsh | 0.0 /100 | #302 | Tragic 1.6% |
| Swiss | 0.0 /100 | #303 | Tragic 1.6% |
| Seminole | 0.0 /100 | #304 | Tragic 1.6% |
| Blackfeet | 0.0 /100 | #305 | Tragic 1.6% |
| Creek | 0.0 /100 | #306 | Tragic 1.6% |
| Scottish | 0.0 /100 | #307 | Tragic 1.6% |
| Navajo | 0.0 /100 | #308 | Tragic 1.6% |
| Cape Verdeans | 0.0 /100 | #309 | Tragic 1.7% |
| Whites/Caucasians | 0.0 /100 | #310 | Tragic 1.7% |
| English | 0.0 /100 | #311 | Tragic 1.7% |
| Puerto Ricans | 0.0 /100 | #312 | Tragic 1.7% |
| Celtics | 0.0 /100 | #313 | Tragic 1.7% |