New Zealander vs Cuban Ambulatory Disability
COMPARE
New Zealander
Cuban
Ambulatory Disability
Ambulatory Disability Comparison
New Zealanders
Cubans
5.8%
AMBULATORY DISABILITY
97.6/ 100
METRIC RATING
104th/ 347
METRIC RANK
6.4%
AMBULATORY DISABILITY
4.0/ 100
METRIC RATING
227th/ 347
METRIC RANK
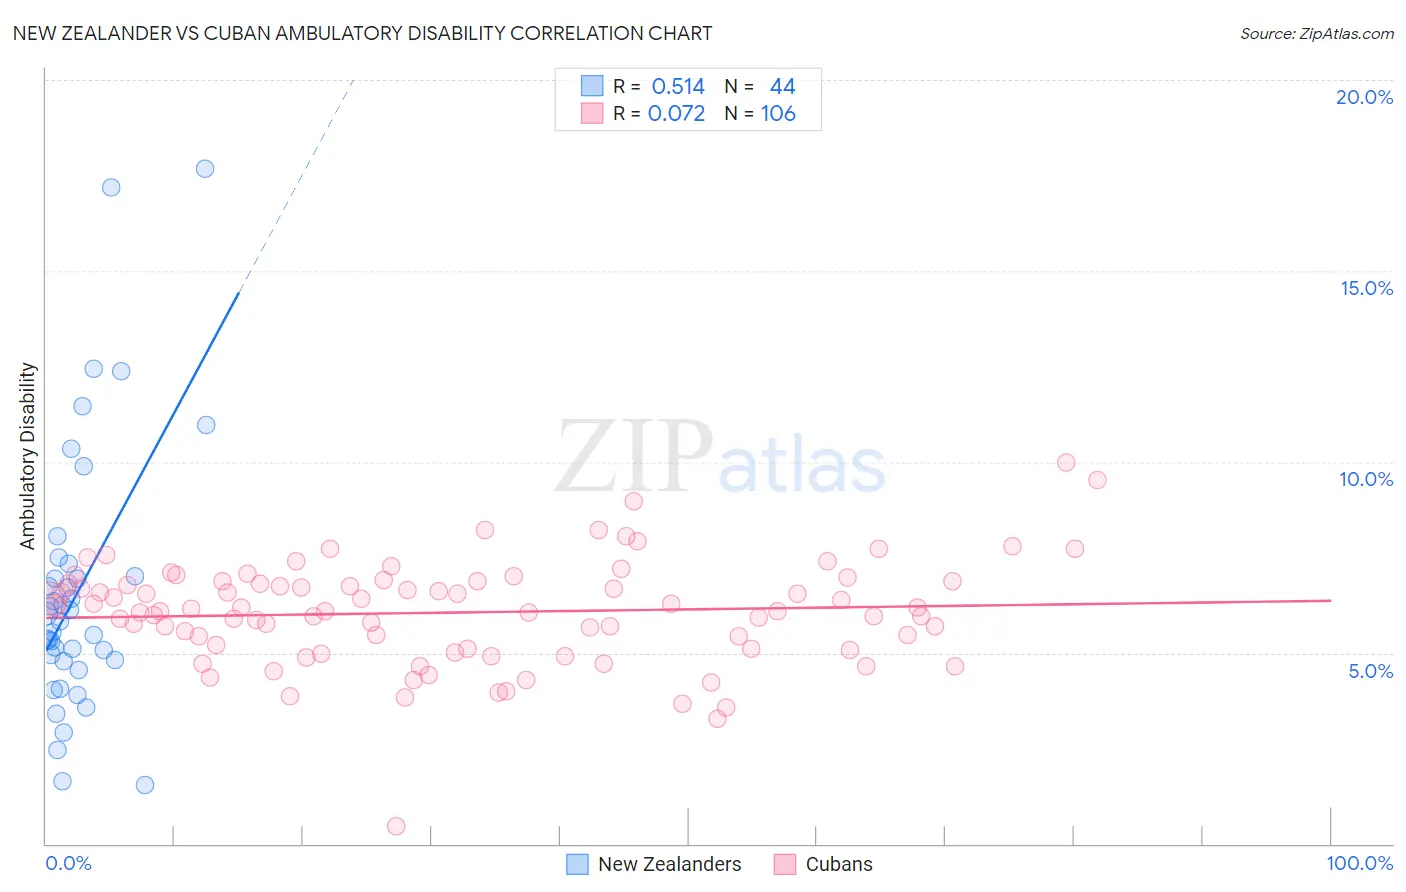
New Zealander vs Cuban Ambulatory Disability Correlation Chart
The statistical analysis conducted on geographies consisting of 106,904,660 people shows a substantial positive correlation between the proportion of New Zealanders and percentage of population with ambulatory disability in the United States with a correlation coefficient (R) of 0.514 and weighted average of 5.8%. Similarly, the statistical analysis conducted on geographies consisting of 449,114,501 people shows a slight positive correlation between the proportion of Cubans and percentage of population with ambulatory disability in the United States with a correlation coefficient (R) of 0.072 and weighted average of 6.4%, a difference of 9.6%.
Ambulatory Disability Correlation Summary
| Measurement | New Zealander | Cuban |
| Minimum | 1.5% | 0.45% |
| Maximum | 17.7% | 10.0% |
| Range | 16.2% | 9.5% |
| Mean | 6.6% | 6.1% |
| Median | 5.9% | 6.1% |
| Interquartile 25% (IQ1) | 4.8% | 5.1% |
| Interquartile 75% (IQ3) | 7.2% | 6.9% |
| Interquartile Range (IQR) | 2.4% | 1.7% |
| Standard Deviation (Sample) | 3.5% | 1.4% |
| Standard Deviation (Population) | 3.4% | 1.4% |
Similar Demographics by Ambulatory Disability
Demographics Similar to New Zealanders by Ambulatory Disability
In terms of ambulatory disability, the demographic groups most similar to New Zealanders are Immigrants from Romania (5.8%, a difference of 0.060%), Immigrants from Czechoslovakia (5.8%, a difference of 0.11%), Immigrants from Kenya (5.8%, a difference of 0.13%), Immigrants from Morocco (5.8%, a difference of 0.18%), and Immigrants from Serbia (5.8%, a difference of 0.21%).
| Demographics | Rating | Rank | Ambulatory Disability |
| Immigrants | Somalia | 98.3 /100 | #97 | Exceptional 5.8% |
| Immigrants | Lebanon | 98.3 /100 | #98 | Exceptional 5.8% |
| Immigrants | Northern Europe | 98.2 /100 | #99 | Exceptional 5.8% |
| Immigrants | Serbia | 97.9 /100 | #100 | Exceptional 5.8% |
| Immigrants | South America | 97.9 /100 | #101 | Exceptional 5.8% |
| Immigrants | Kenya | 97.8 /100 | #102 | Exceptional 5.8% |
| Immigrants | Romania | 97.7 /100 | #103 | Exceptional 5.8% |
| New Zealanders | 97.6 /100 | #104 | Exceptional 5.8% |
| Immigrants | Czechoslovakia | 97.4 /100 | #105 | Exceptional 5.8% |
| Immigrants | Morocco | 97.3 /100 | #106 | Exceptional 5.8% |
| Uruguayans | 97.2 /100 | #107 | Exceptional 5.8% |
| Colombians | 97.2 /100 | #108 | Exceptional 5.8% |
| Immigrants | Netherlands | 97.1 /100 | #109 | Exceptional 5.8% |
| Immigrants | Colombia | 96.7 /100 | #110 | Exceptional 5.8% |
| Danes | 96.6 /100 | #111 | Exceptional 5.8% |
Demographics Similar to Cubans by Ambulatory Disability
In terms of ambulatory disability, the demographic groups most similar to Cubans are Portuguese (6.4%, a difference of 0.010%), Czechoslovakian (6.4%, a difference of 0.060%), Mexican (6.4%, a difference of 0.17%), Panamanian (6.4%, a difference of 0.32%), and Slavic (6.4%, a difference of 0.33%).
| Demographics | Rating | Rank | Ambulatory Disability |
| Immigrants | Albania | 9.6 /100 | #220 | Tragic 6.3% |
| Hungarians | 9.6 /100 | #221 | Tragic 6.3% |
| German Russians | 9.4 /100 | #222 | Tragic 6.3% |
| Immigrants | Honduras | 7.6 /100 | #223 | Tragic 6.3% |
| Liberians | 7.1 /100 | #224 | Tragic 6.3% |
| Hondurans | 6.3 /100 | #225 | Tragic 6.3% |
| Slavs | 5.1 /100 | #226 | Tragic 6.4% |
| Cubans | 4.0 /100 | #227 | Tragic 6.4% |
| Portuguese | 4.0 /100 | #228 | Tragic 6.4% |
| Czechoslovakians | 3.8 /100 | #229 | Tragic 6.4% |
| Mexicans | 3.5 /100 | #230 | Tragic 6.4% |
| Panamanians | 3.1 /100 | #231 | Tragic 6.4% |
| Assyrians/Chaldeans/Syriacs | 2.4 /100 | #232 | Tragic 6.4% |
| Sub-Saharan Africans | 2.3 /100 | #233 | Tragic 6.4% |
| Immigrants | Liberia | 2.3 /100 | #234 | Tragic 6.4% |