Black/African American vs Cuban Ambulatory Disability
COMPARE
Black/African American
Cuban
Ambulatory Disability
Ambulatory Disability Comparison
Blacks/African Americans
Cubans
7.5%
AMBULATORY DISABILITY
0.0/ 100
METRIC RATING
326th/ 347
METRIC RANK
6.4%
AMBULATORY DISABILITY
4.0/ 100
METRIC RATING
227th/ 347
METRIC RANK
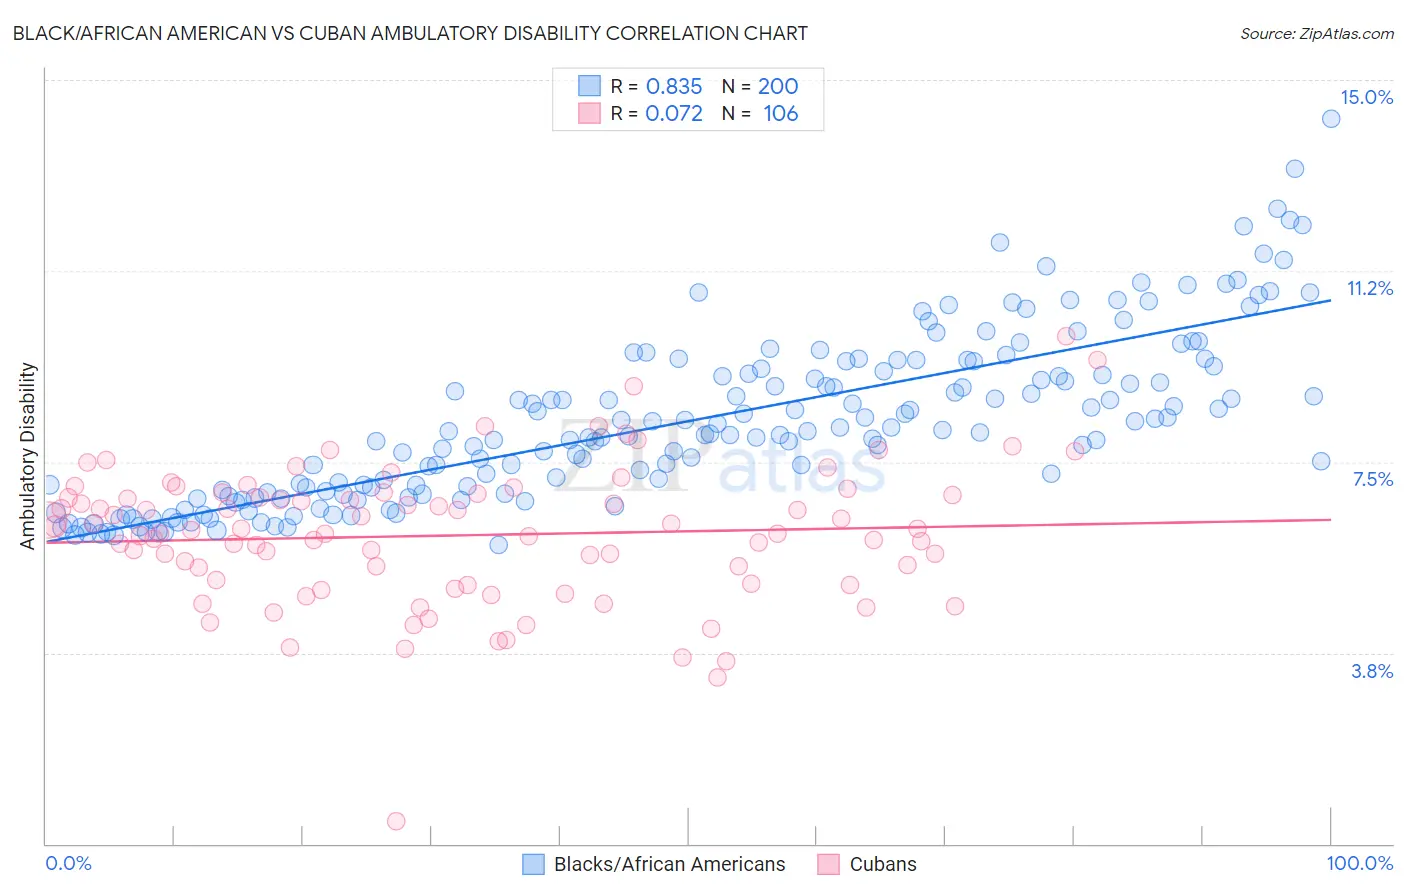
Black/African American vs Cuban Ambulatory Disability Correlation Chart
The statistical analysis conducted on geographies consisting of 565,519,006 people shows a very strong positive correlation between the proportion of Blacks/African Americans and percentage of population with ambulatory disability in the United States with a correlation coefficient (R) of 0.835 and weighted average of 7.5%. Similarly, the statistical analysis conducted on geographies consisting of 449,114,501 people shows a slight positive correlation between the proportion of Cubans and percentage of population with ambulatory disability in the United States with a correlation coefficient (R) of 0.072 and weighted average of 6.4%, a difference of 18.0%.
Ambulatory Disability Correlation Summary
| Measurement | Black/African American | Cuban |
| Minimum | 5.9% | 0.45% |
| Maximum | 14.3% | 10.0% |
| Range | 8.4% | 9.5% |
| Mean | 8.3% | 6.1% |
| Median | 8.1% | 6.1% |
| Interquartile 25% (IQ1) | 6.9% | 5.1% |
| Interquartile 75% (IQ3) | 9.3% | 6.9% |
| Interquartile Range (IQR) | 2.4% | 1.7% |
| Standard Deviation (Sample) | 1.6% | 1.4% |
| Standard Deviation (Population) | 1.6% | 1.4% |
Similar Demographics by Ambulatory Disability
Demographics Similar to Blacks/African Americans by Ambulatory Disability
In terms of ambulatory disability, the demographic groups most similar to Blacks/African Americans are Native/Alaskan (7.5%, a difference of 0.010%), Comanche (7.5%, a difference of 0.11%), Navajo (7.5%, a difference of 0.18%), Hopi (7.6%, a difference of 0.95%), and Pueblo (7.6%, a difference of 0.99%).
| Demographics | Rating | Rank | Ambulatory Disability |
| Dominicans | 0.0 /100 | #319 | Tragic 7.2% |
| Potawatomi | 0.0 /100 | #320 | Tragic 7.3% |
| Apache | 0.0 /100 | #321 | Tragic 7.4% |
| Osage | 0.0 /100 | #322 | Tragic 7.4% |
| Americans | 0.0 /100 | #323 | Tragic 7.4% |
| Navajo | 0.0 /100 | #324 | Tragic 7.5% |
| Comanche | 0.0 /100 | #325 | Tragic 7.5% |
| Blacks/African Americans | 0.0 /100 | #326 | Tragic 7.5% |
| Natives/Alaskans | 0.0 /100 | #327 | Tragic 7.5% |
| Hopi | 0.0 /100 | #328 | Tragic 7.6% |
| Pueblo | 0.0 /100 | #329 | Tragic 7.6% |
| Paiute | 0.0 /100 | #330 | Tragic 7.7% |
| Cajuns | 0.0 /100 | #331 | Tragic 7.8% |
| Menominee | 0.0 /100 | #332 | Tragic 7.8% |
| Cherokee | 0.0 /100 | #333 | Tragic 7.9% |
Demographics Similar to Cubans by Ambulatory Disability
In terms of ambulatory disability, the demographic groups most similar to Cubans are Portuguese (6.4%, a difference of 0.010%), Czechoslovakian (6.4%, a difference of 0.060%), Mexican (6.4%, a difference of 0.17%), Panamanian (6.4%, a difference of 0.32%), and Slavic (6.4%, a difference of 0.33%).
| Demographics | Rating | Rank | Ambulatory Disability |
| Immigrants | Albania | 9.6 /100 | #220 | Tragic 6.3% |
| Hungarians | 9.6 /100 | #221 | Tragic 6.3% |
| German Russians | 9.4 /100 | #222 | Tragic 6.3% |
| Immigrants | Honduras | 7.6 /100 | #223 | Tragic 6.3% |
| Liberians | 7.1 /100 | #224 | Tragic 6.3% |
| Hondurans | 6.3 /100 | #225 | Tragic 6.3% |
| Slavs | 5.1 /100 | #226 | Tragic 6.4% |
| Cubans | 4.0 /100 | #227 | Tragic 6.4% |
| Portuguese | 4.0 /100 | #228 | Tragic 6.4% |
| Czechoslovakians | 3.8 /100 | #229 | Tragic 6.4% |
| Mexicans | 3.5 /100 | #230 | Tragic 6.4% |
| Panamanians | 3.1 /100 | #231 | Tragic 6.4% |
| Assyrians/Chaldeans/Syriacs | 2.4 /100 | #232 | Tragic 6.4% |
| Sub-Saharan Africans | 2.3 /100 | #233 | Tragic 6.4% |
| Immigrants | Liberia | 2.3 /100 | #234 | Tragic 6.4% |