Israeli vs Latvian Ambulatory Disability
COMPARE
Israeli
Latvian
Ambulatory Disability
Ambulatory Disability Comparison
Israelis
Latvians
5.7%
AMBULATORY DISABILITY
99.6/ 100
METRIC RATING
66th/ 347
METRIC RANK
5.7%
AMBULATORY DISABILITY
99.0/ 100
METRIC RATING
86th/ 347
METRIC RANK
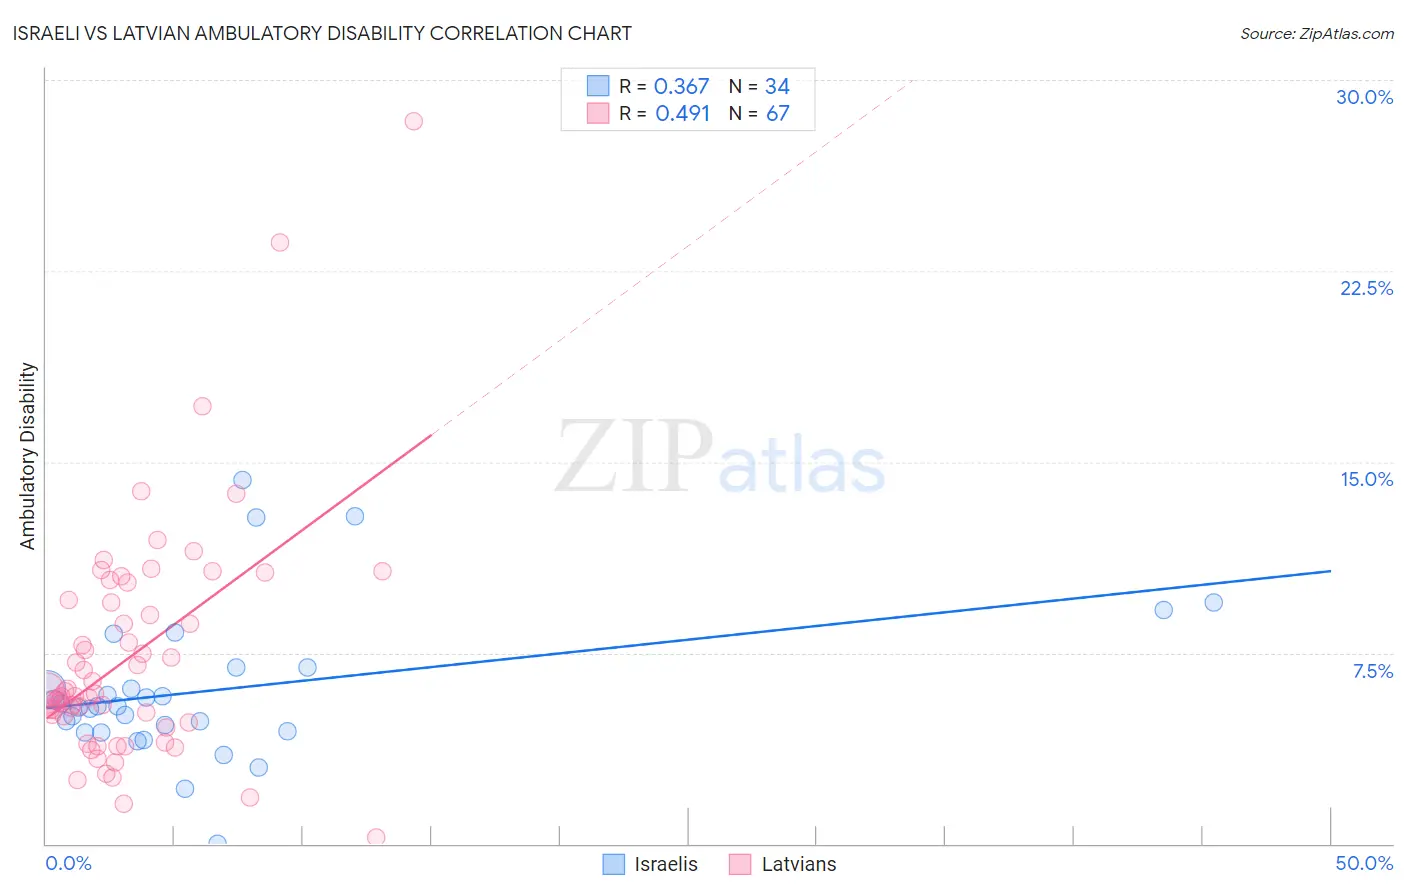
Israeli vs Latvian Ambulatory Disability Correlation Chart
The statistical analysis conducted on geographies consisting of 211,116,012 people shows a mild positive correlation between the proportion of Israelis and percentage of population with ambulatory disability in the United States with a correlation coefficient (R) of 0.367 and weighted average of 5.7%. Similarly, the statistical analysis conducted on geographies consisting of 220,706,558 people shows a moderate positive correlation between the proportion of Latvians and percentage of population with ambulatory disability in the United States with a correlation coefficient (R) of 0.491 and weighted average of 5.7%, a difference of 1.5%.
Ambulatory Disability Correlation Summary
| Measurement | Israeli | Latvian |
| Minimum | 0.023% | 0.23% |
| Maximum | 14.3% | 28.4% |
| Range | 14.3% | 28.1% |
| Mean | 6.0% | 7.3% |
| Median | 5.4% | 5.9% |
| Interquartile 25% (IQ1) | 4.4% | 4.8% |
| Interquartile 75% (IQ3) | 6.9% | 9.6% |
| Interquartile Range (IQR) | 2.5% | 4.8% |
| Standard Deviation (Sample) | 3.0% | 4.6% |
| Standard Deviation (Population) | 2.9% | 4.6% |
Demographics Similar to Israelis and Latvians by Ambulatory Disability
In terms of ambulatory disability, the demographic groups most similar to Israelis are Immigrants from Uganda (5.7%, a difference of 0.010%), Sri Lankan (5.7%, a difference of 0.040%), Peruvian (5.7%, a difference of 0.47%), Sierra Leonean (5.7%, a difference of 0.71%), and Immigrants from Peru (5.7%, a difference of 0.79%). Similarly, the demographic groups most similar to Latvians are South American (5.7%, a difference of 0.030%), Ugandan (5.7%, a difference of 0.27%), Eastern European (5.7%, a difference of 0.28%), Palestinian (5.7%, a difference of 0.29%), and Immigrants from Jordan (5.7%, a difference of 0.30%).
| Demographics | Rating | Rank | Ambulatory Disability |
| Israelis | 99.6 /100 | #66 | Exceptional 5.7% |
| Immigrants | Uganda | 99.6 /100 | #67 | Exceptional 5.7% |
| Sri Lankans | 99.6 /100 | #68 | Exceptional 5.7% |
| Peruvians | 99.5 /100 | #69 | Exceptional 5.7% |
| Sierra Leoneans | 99.4 /100 | #70 | Exceptional 5.7% |
| Immigrants | Peru | 99.4 /100 | #71 | Exceptional 5.7% |
| Brazilians | 99.4 /100 | #72 | Exceptional 5.7% |
| Immigrants | Northern Africa | 99.4 /100 | #73 | Exceptional 5.7% |
| Immigrants | Cameroon | 99.4 /100 | #74 | Exceptional 5.7% |
| Immigrants | South Africa | 99.3 /100 | #75 | Exceptional 5.7% |
| Sudanese | 99.3 /100 | #76 | Exceptional 5.7% |
| Immigrants | Vietnam | 99.3 /100 | #77 | Exceptional 5.7% |
| Somalis | 99.2 /100 | #78 | Exceptional 5.7% |
| Chileans | 99.2 /100 | #79 | Exceptional 5.7% |
| Immigrants | Ireland | 99.2 /100 | #80 | Exceptional 5.7% |
| Immigrants | Jordan | 99.2 /100 | #81 | Exceptional 5.7% |
| Palestinians | 99.2 /100 | #82 | Exceptional 5.7% |
| Eastern Europeans | 99.2 /100 | #83 | Exceptional 5.7% |
| Ugandans | 99.2 /100 | #84 | Exceptional 5.7% |
| South Americans | 99.0 /100 | #85 | Exceptional 5.7% |
| Latvians | 99.0 /100 | #86 | Exceptional 5.7% |